-
-

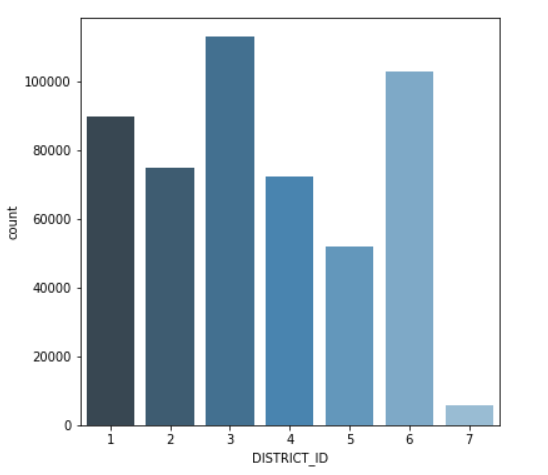
crimes in each district
-

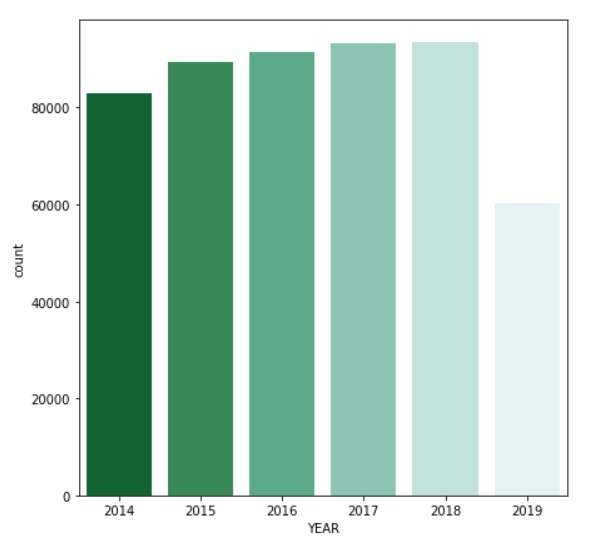
crimes each year
-
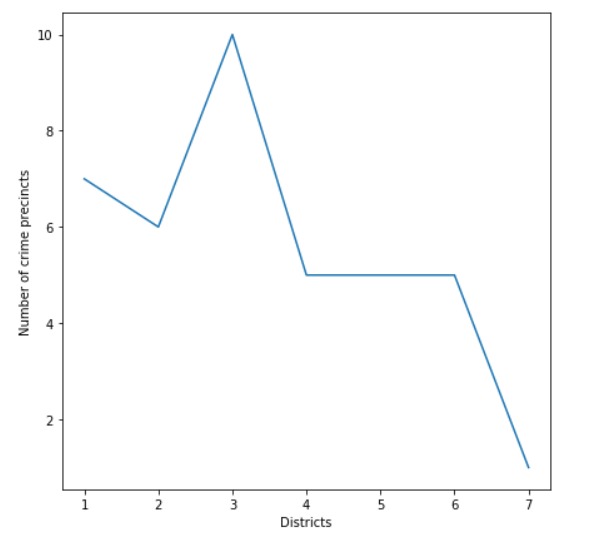
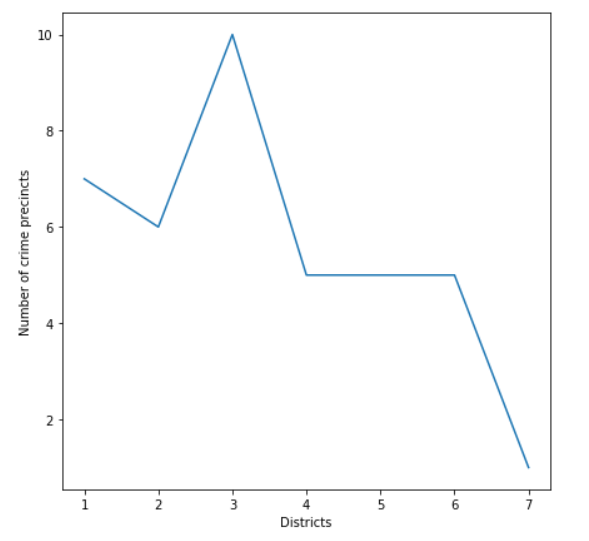
number of crime precincts in the districts
-
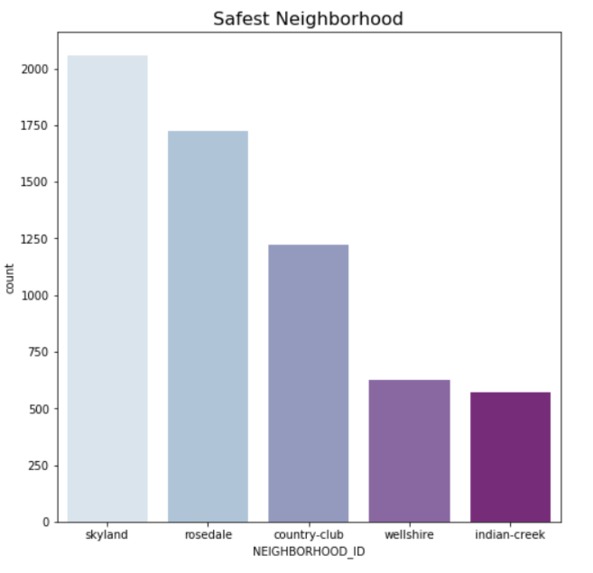
safest neighbours
-

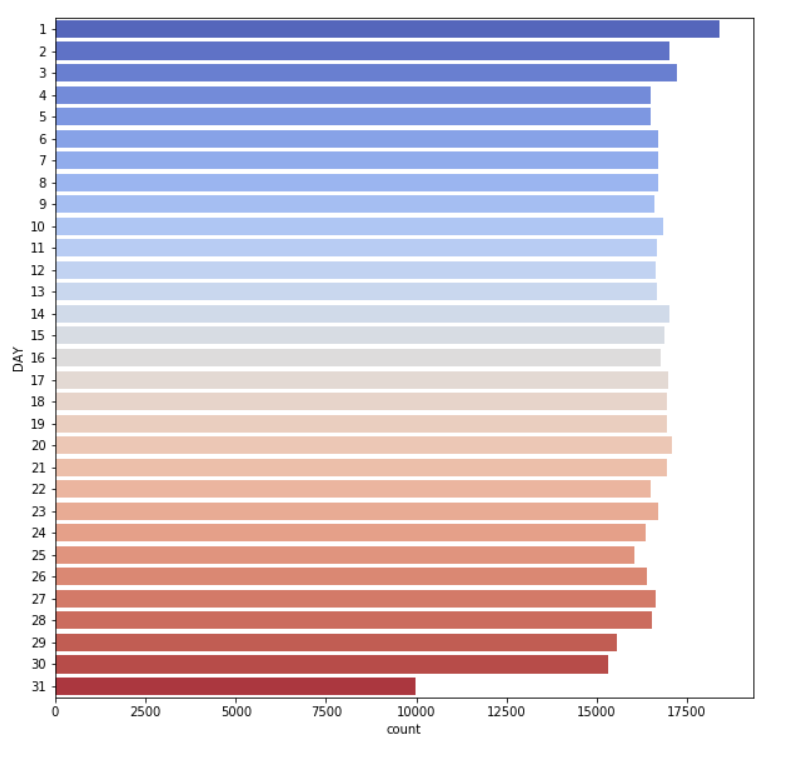
count of crimes on different days
-
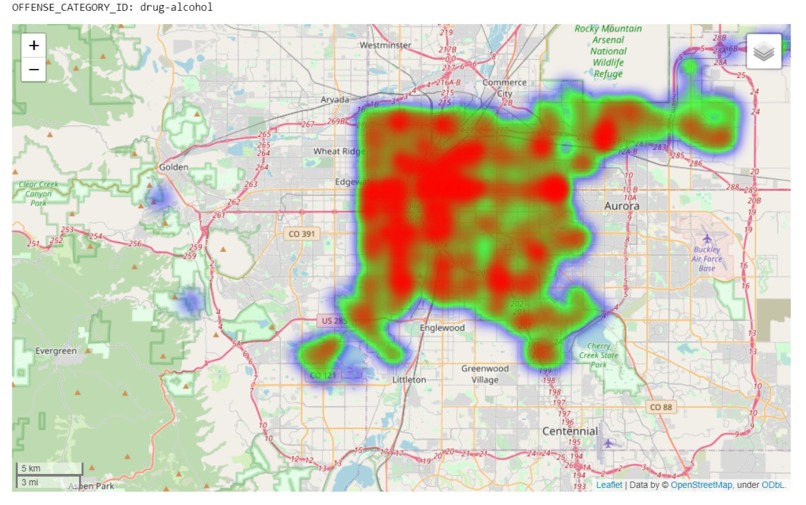
The drug alcohol crime region analysis
-

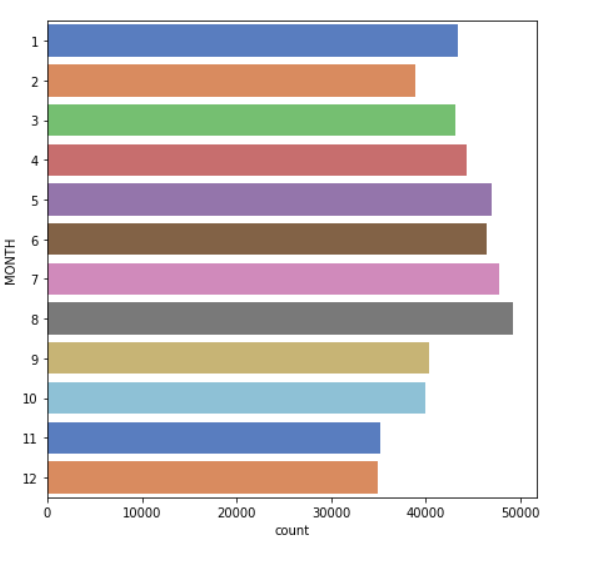
number of crimes in each month
-
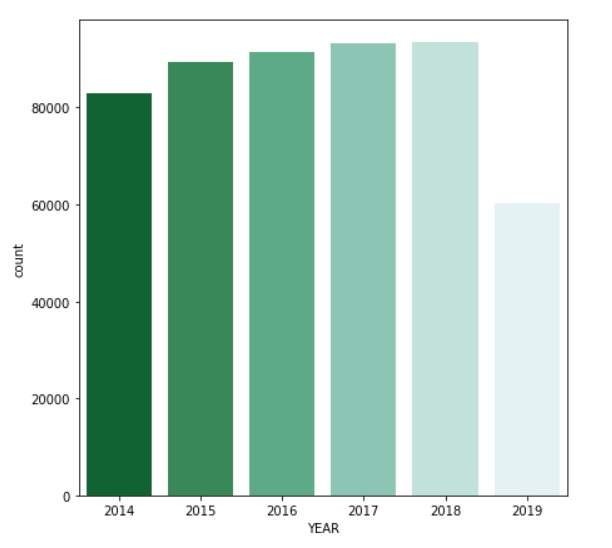
number of crimes each year
-
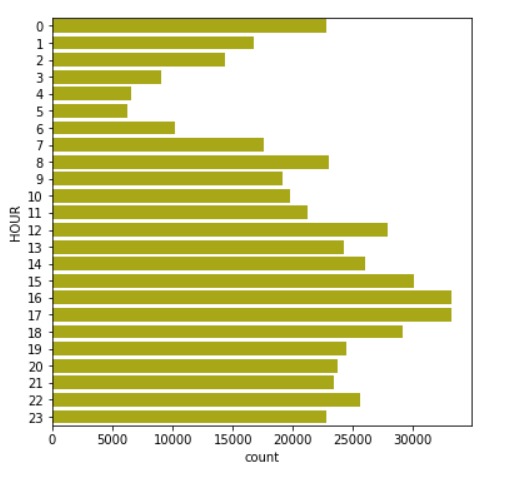
number of crimes in each hour
-
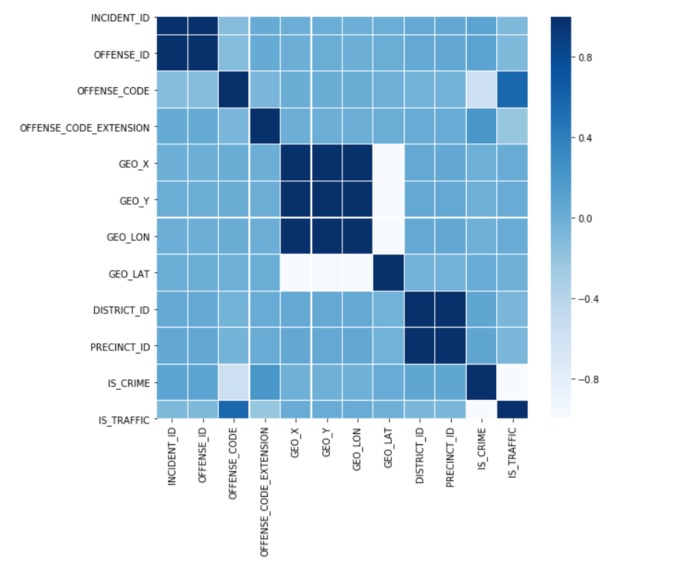
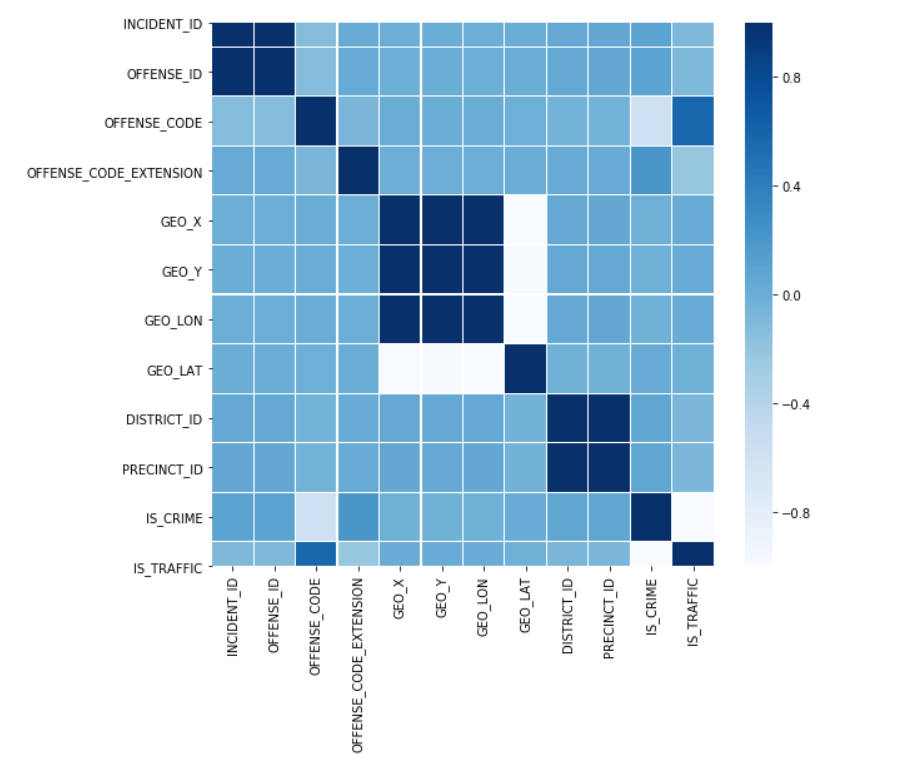
correlation between different features of the dataframe


Inspiration
It is seen that a hike in the crimes has no end and it becomes very important to incorporate new ways to track down criminals and reduce these crimes. Where each domain of the technology provides help to this problem ranging from surveillance to biometrics, I have tried to bring out some help from the field of data science. I have performed an exploratory data analysis on the dataset of crimes in the city of Denver.
What it does
This in-depth analysis helps to bring out useful insights from the given data. From this analysis, I was able to come to some very useful conclusions like which cities are most prone to crimes, which time of the year, time of the month, and which time of the day is most dangerous. The districts and precincts with the most crimes, the safest and dangerous neighbors. These insights can be used to make useful decisions by the higher authorities to take required actions and increase security.
How I built it
I performed this analysis using python and libraries like pandas, NumPy, matplotlib, seaborn, folium in jupyter lab.
Challenges I ran into
The data was of large size which made it a bit difficult to manage it at first. After that, the choice of plots to better visualize the data was a bit confusing.
Accomplishments that I am proud of
The EDA is capable of giving meaningful insights and provide meaning to the data.
What I learned
I learned different techniques of drawing better insights from the data ranging from different visualization libraries to feature selection and data cleaning.
What's next for Crime Analysis
I will try to make a dashboard with the help of these plots.


Log in or sign up for Devpost to join the conversation.