-
-

-
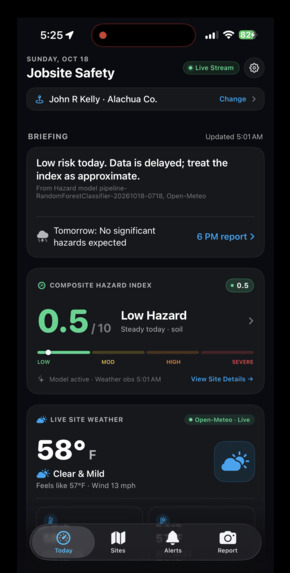
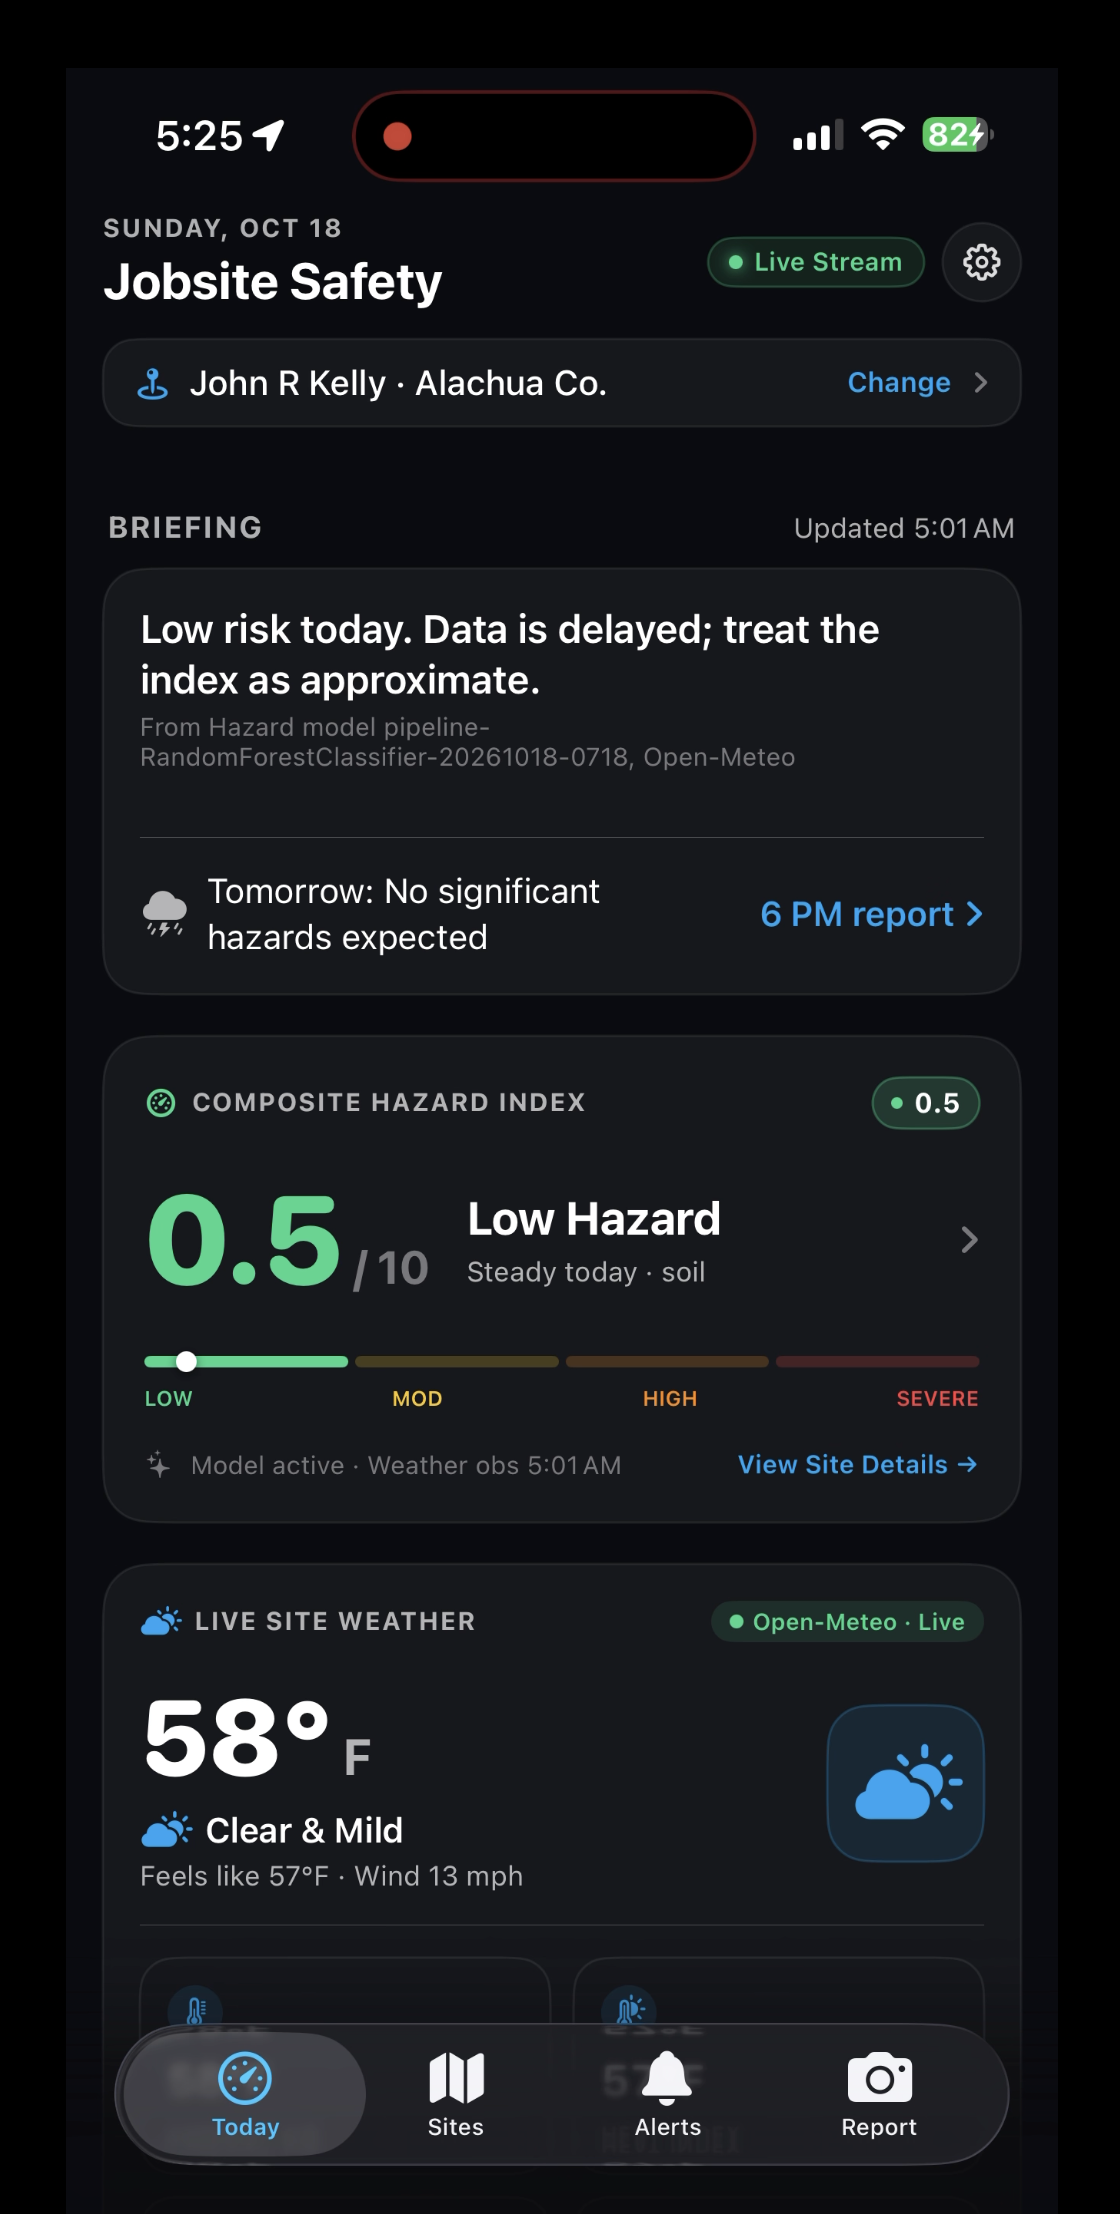
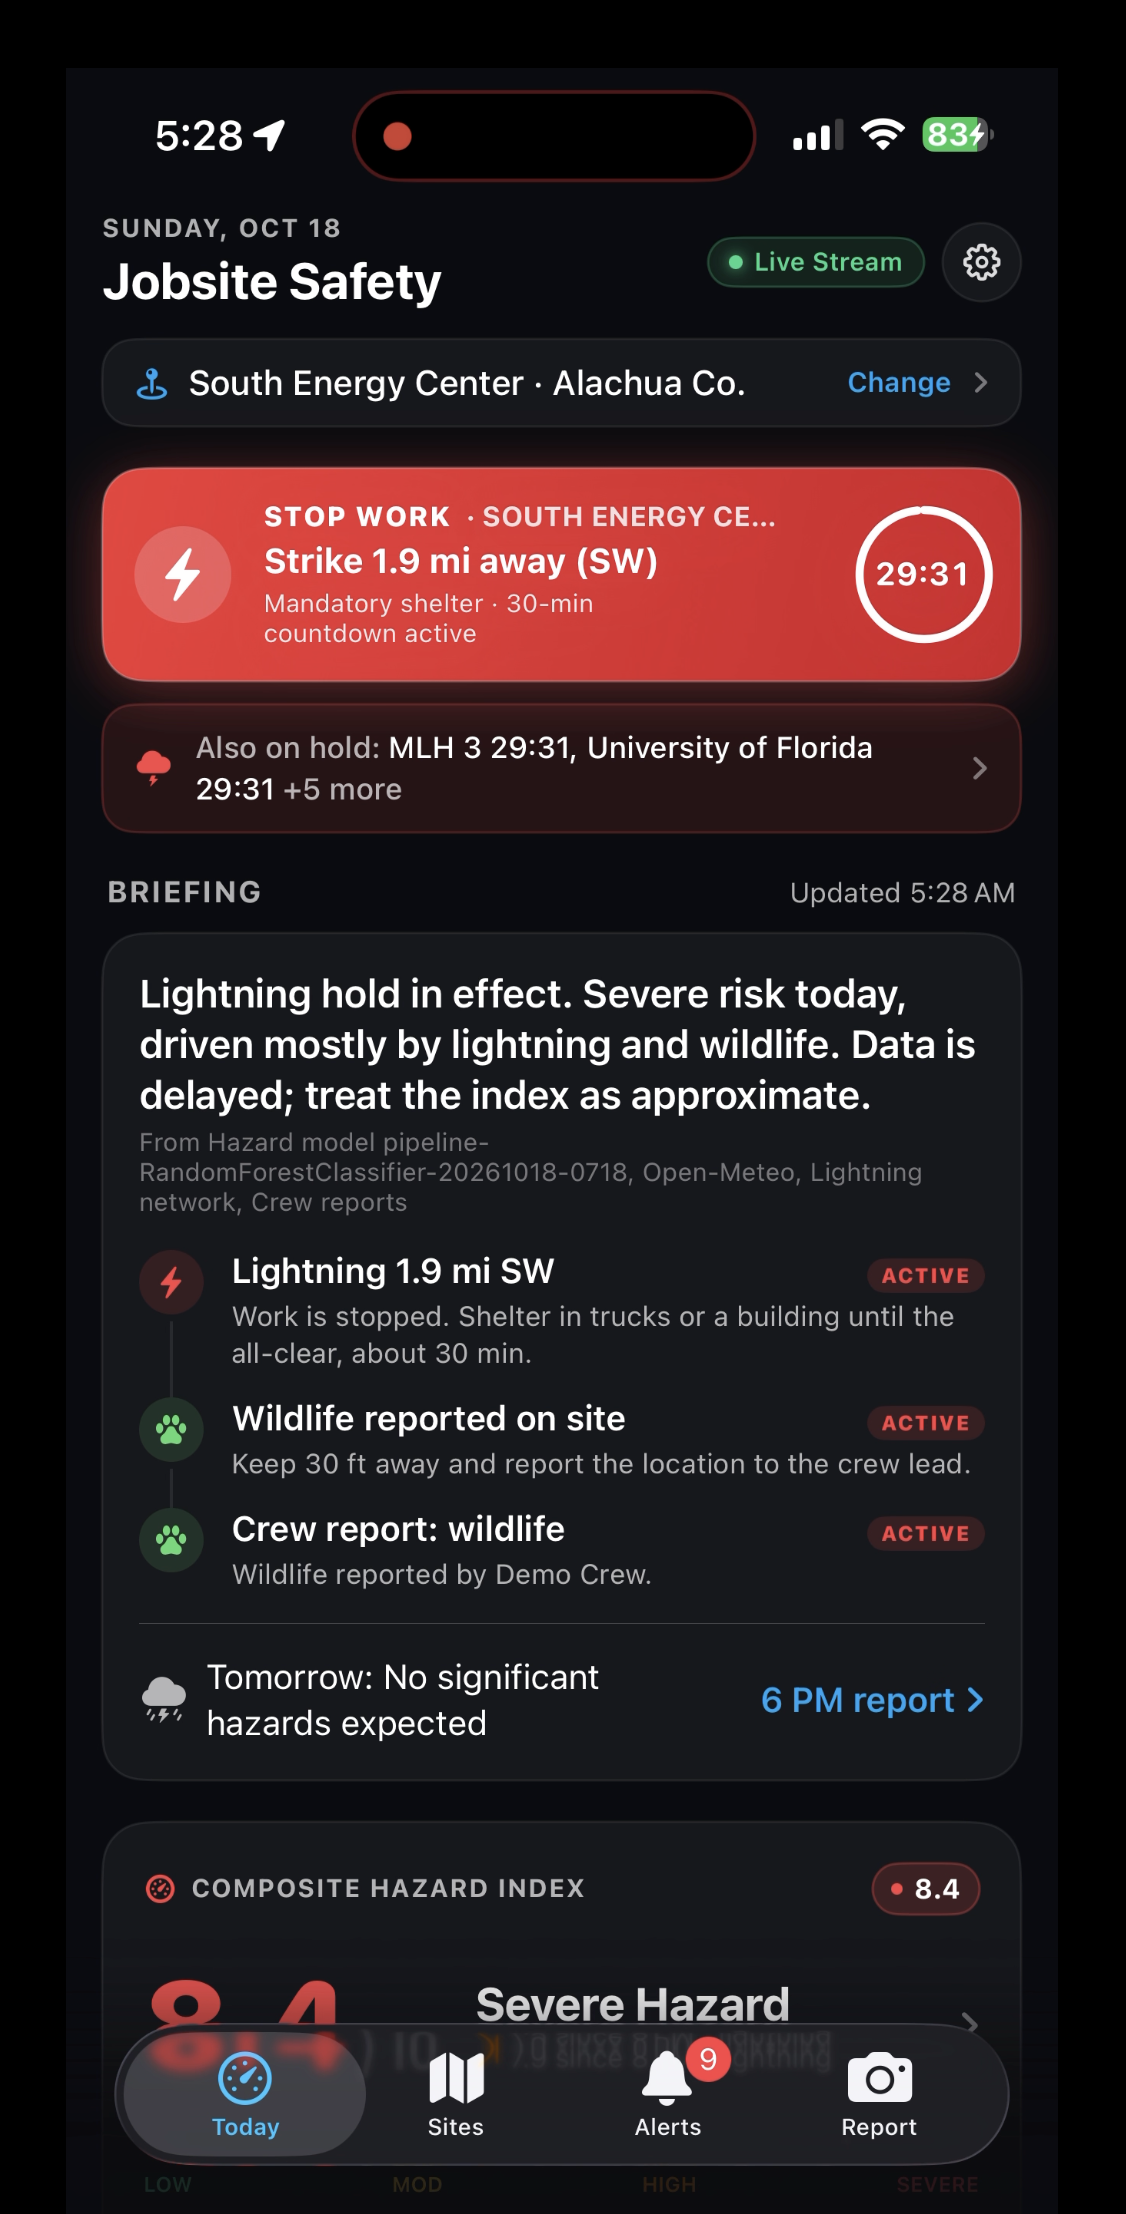
Home Screen with Hazard Score
-
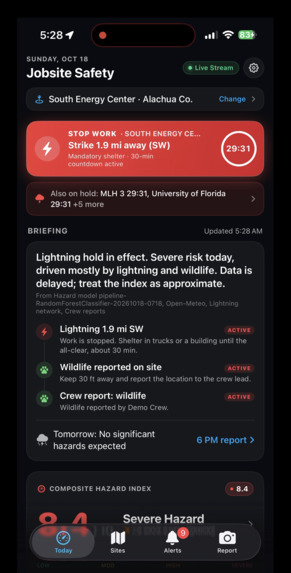
Lightning Warning
-
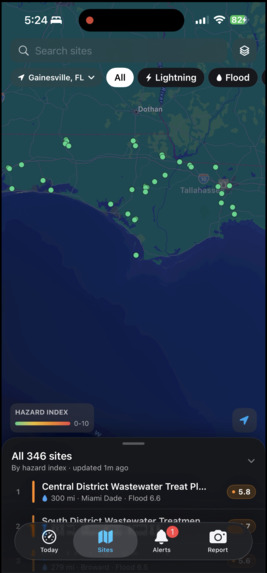
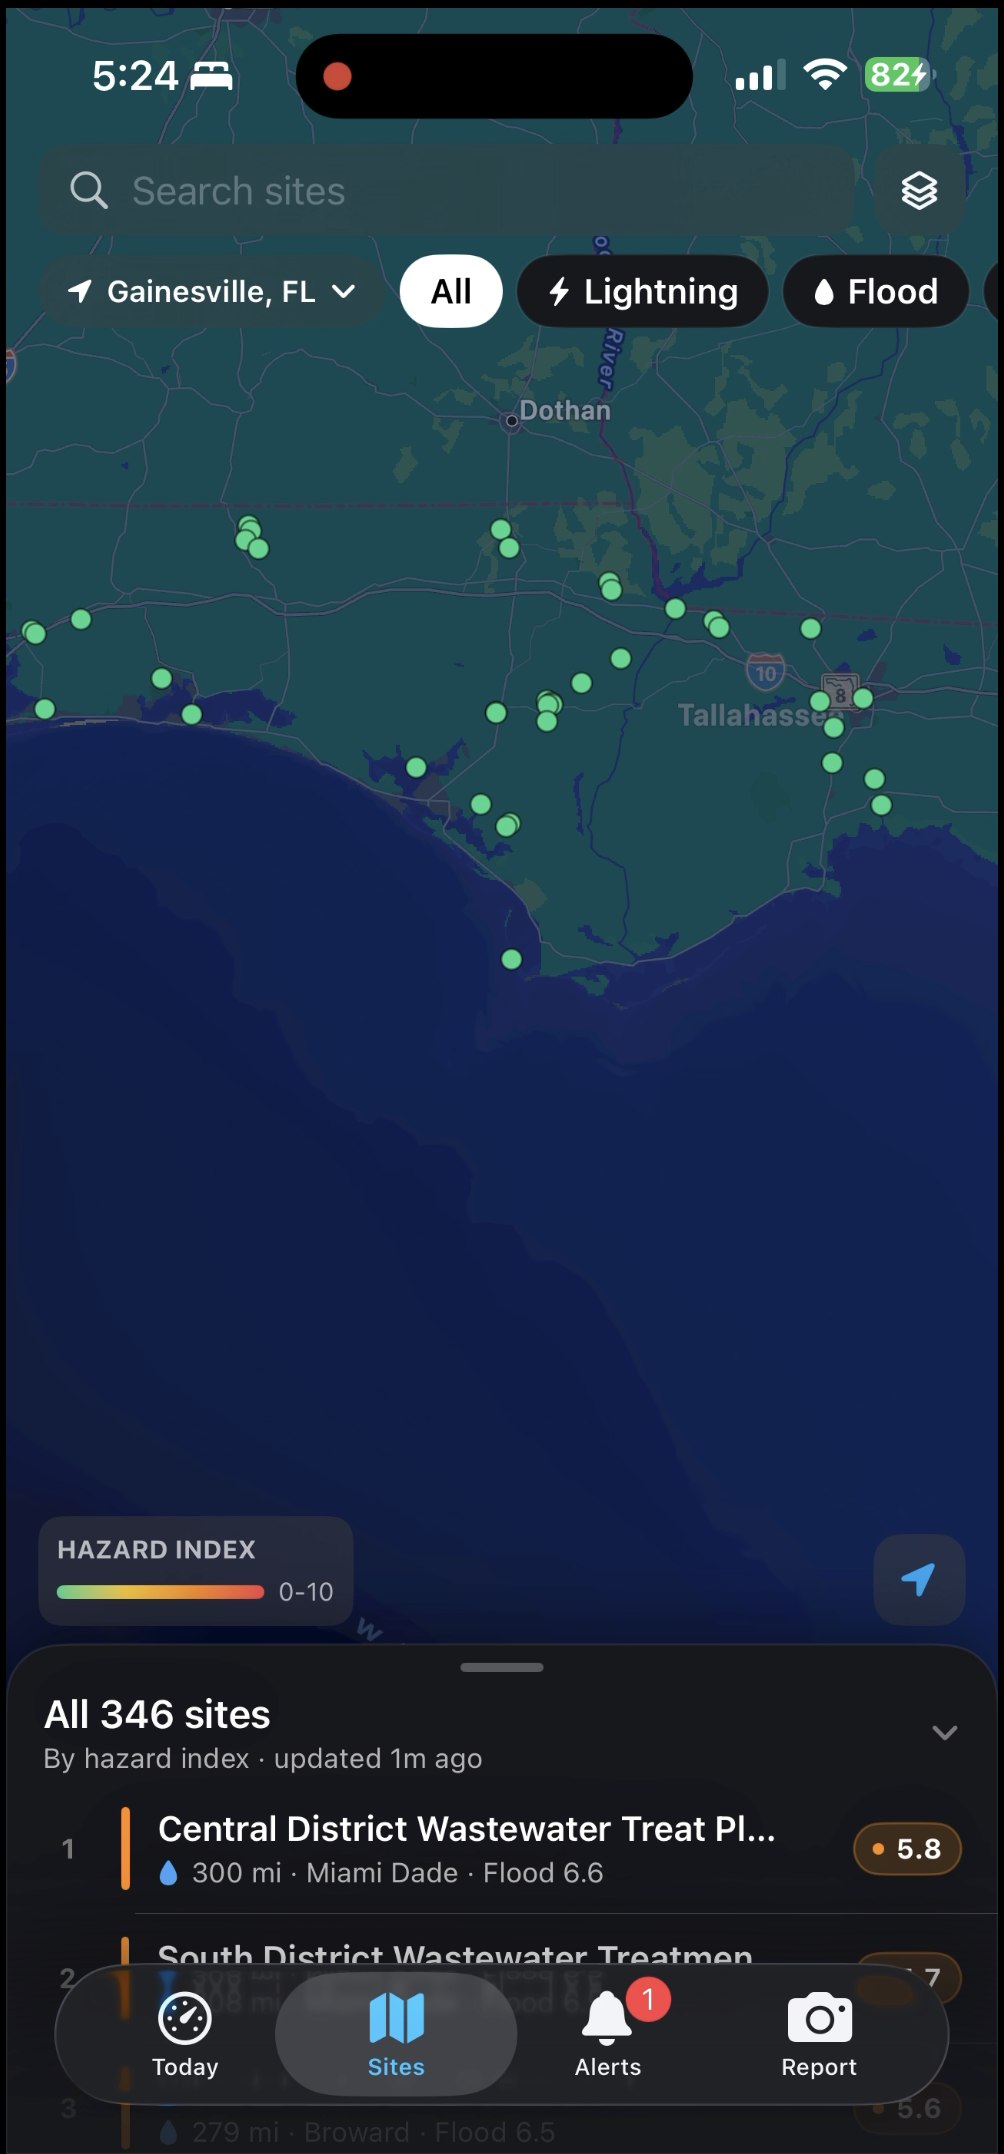
Dashboard Screen

Inspiration
Utility crews work in some of the harshest conditions in the country: extreme heat, sudden lightning, flooded access roads, saturated ground, wildfire, and wildlife near the job site. Almost all of it is knowable ahead of time. But the data is scattered across a dozen apps and agencies, a critical sighting can live in one person's text messages, and the go/no-go call is often made on instinct the morning of. The PlanIT Control challenge from Sperry Tech described exactly that problem, and we wanted to build the tool that turns scattered hazard data into a decision.
What it does
Heron is an iOS app that gives utility crews and supervisors one clear picture of the hazards around every job site. • One combined risk picture per site: weather, extreme heat, lightning, flooding, wildfire, soil saturation, and wildlife sightings together, for [X] real power plant locations. • Hazard index (0-10): an XGBoost model trained on historical weather and incident data produces a score for each site, and the app shows which conditions are driving it. • Instant alerts: a lightning strike within 10 miles triggers a stop-work alert with a 30-minute all-clear countdown that restarts with every new strike. Sites along rivers get a flood-risk warning after heavy overnight rain. • Daily briefing: every evening at 6 PM local time, Heron sends a next-day safety report so supervisors plan ahead instead of reacting. • Crew hazard reporting: a crew member snaps a photo, pins the hazard on the site map, and shares it with the team. Reports also build a shared database of location hazards for future project owners. • Supervisor dashboard: a map that ranks sites by risk, showing where to focus attention and resources first.
How we built it
• Data intake: Python pollers pull weather and National Weather Service alerts for each site on a schedule and publish them to Apache Kafka. • Processing: a transformer validates each reading, rejects impossible values, removes duplicates, and derives features such as rolling 3- and 7-day rainfall. A scoring service runs the model and our safety rules, and an alert service decides when to notify and avoids repeat alerts. • Model: XGBoost (gradient-boosted decision trees) trained on lightning, wildfire, flooding, and other incident datasets across Florida and the rest of the US, joined to weather, temperature, humidity, and wind data. We split by time rather than randomly, compared against a baseline, and checked calibration. [Add the exact datasets and your key metrics.] • Backend: FastAPI serves a REST API and a WebSocket for live updates, backed by Postgres. The app only ever talks to this API. • Frontend: a native iOS app built with SwiftUI and MapKit. • Safety logic: the overall site level is driven by the worst hazard rather than an average, and confirmed crew reports adjust the displayed level through transparent rules, with the reason shown.
Challenges we ran into
Keep only the ones that actually happened to you. • Messy, mismatched data. Incident datasets differ in format, location detail, and time coverage, and joining them to weather by place and day took more work than the modeling. • Labels are proxies. Public incident records show when events occurred in a region, not exactly what hurts workers on a job site, so we scoped our claims to regional hazard conditions. • Avoiding leakage. Weather is strongly autocorrelated, so a random split would have made the model look better than it is. We moved to time-based splits and built features only from information available before the prediction. • Training on observed weather but serving from forecasts. Forecasts are noisier, so live performance will be somewhat lower than our backtest. • Real-time on iOS. WebSocket connections are suspended when the app is backgrounded, and push notifications need extra setup, so we designed around foreground live updates and a refresh on return. • Limited time. We cut features to ship one complete end-to-end flow rather than many half-finished ones.
Accomplishments that we're proud of
• A working pipeline from live weather data to a scored, explained hazard level in the app. • A model that beats a historical-average baseline by 90%, with calibration we can show. • The lightning stop-work alert with a countdown that resets on each new strike. • A crew reporting flow that moves a photo and pin from a phone to a supervisor's screen in seconds. • An app whose recommendations come with reasons, so a supervisor can see why and disagree.
What we learned
• Data engineering decides whether a machine learning project is believable: label definitions, joins, and time-based validation mattered more than which algorithm we picked. • Boosted trees were the right fit for moderately sized tabular data, and they let us explain each prediction. • Safety products need honesty about what they don't know: flagging stale data and describing the model as regional risk, not injury prediction. • Event-driven design with Kafka makes failures recoverable, but it adds setup time, so scope matters in a short hackathon.
What's next for Heron
• Retrain the model on real crew reports once we have enough, and validate thresholds with working safety managers. • Pilot at one real job site and measure whether supervisors' decisions change. • Add an offline-first mode and an SMS fallback for remote sites with poor signal. • Expand data sources, including levee, tide, and FEMA flood-zone data, and tune the model for sites near rivers and coasts. • Add an audit log of every recommendation and who acknowledged it, for compliance and review.
Built With
- api
- docker
- fastapi
- kafka
- noaa
- postgresql
- python
- swift
- xgboost

Log in or sign up for Devpost to join the conversation.