-
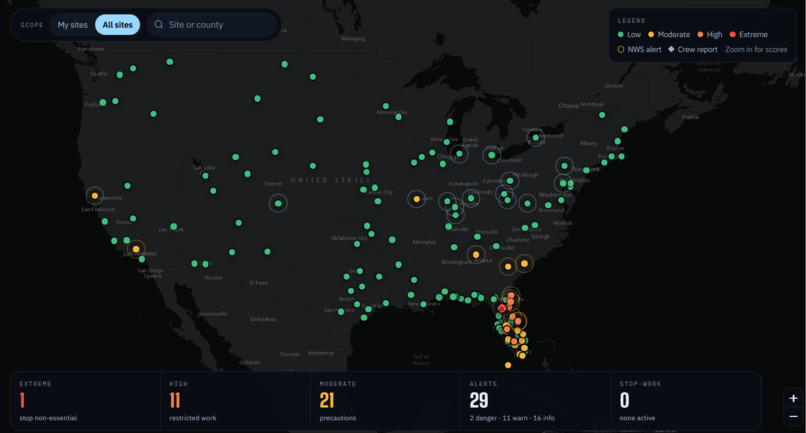
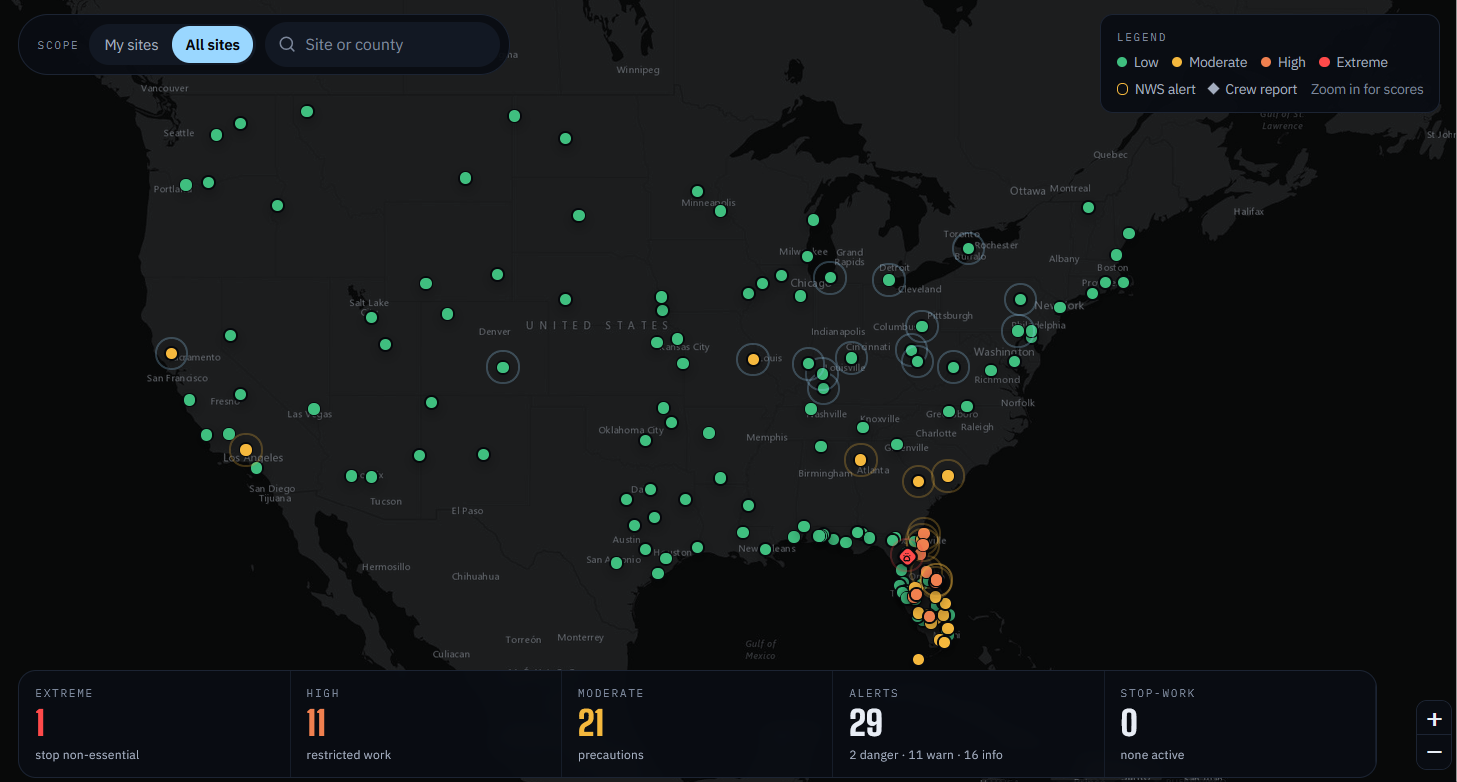
dashboard map UI to show hazard index gradiants all across US
-
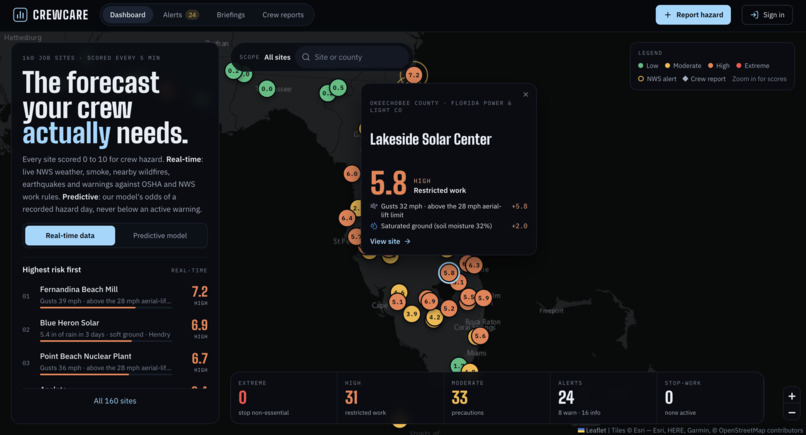
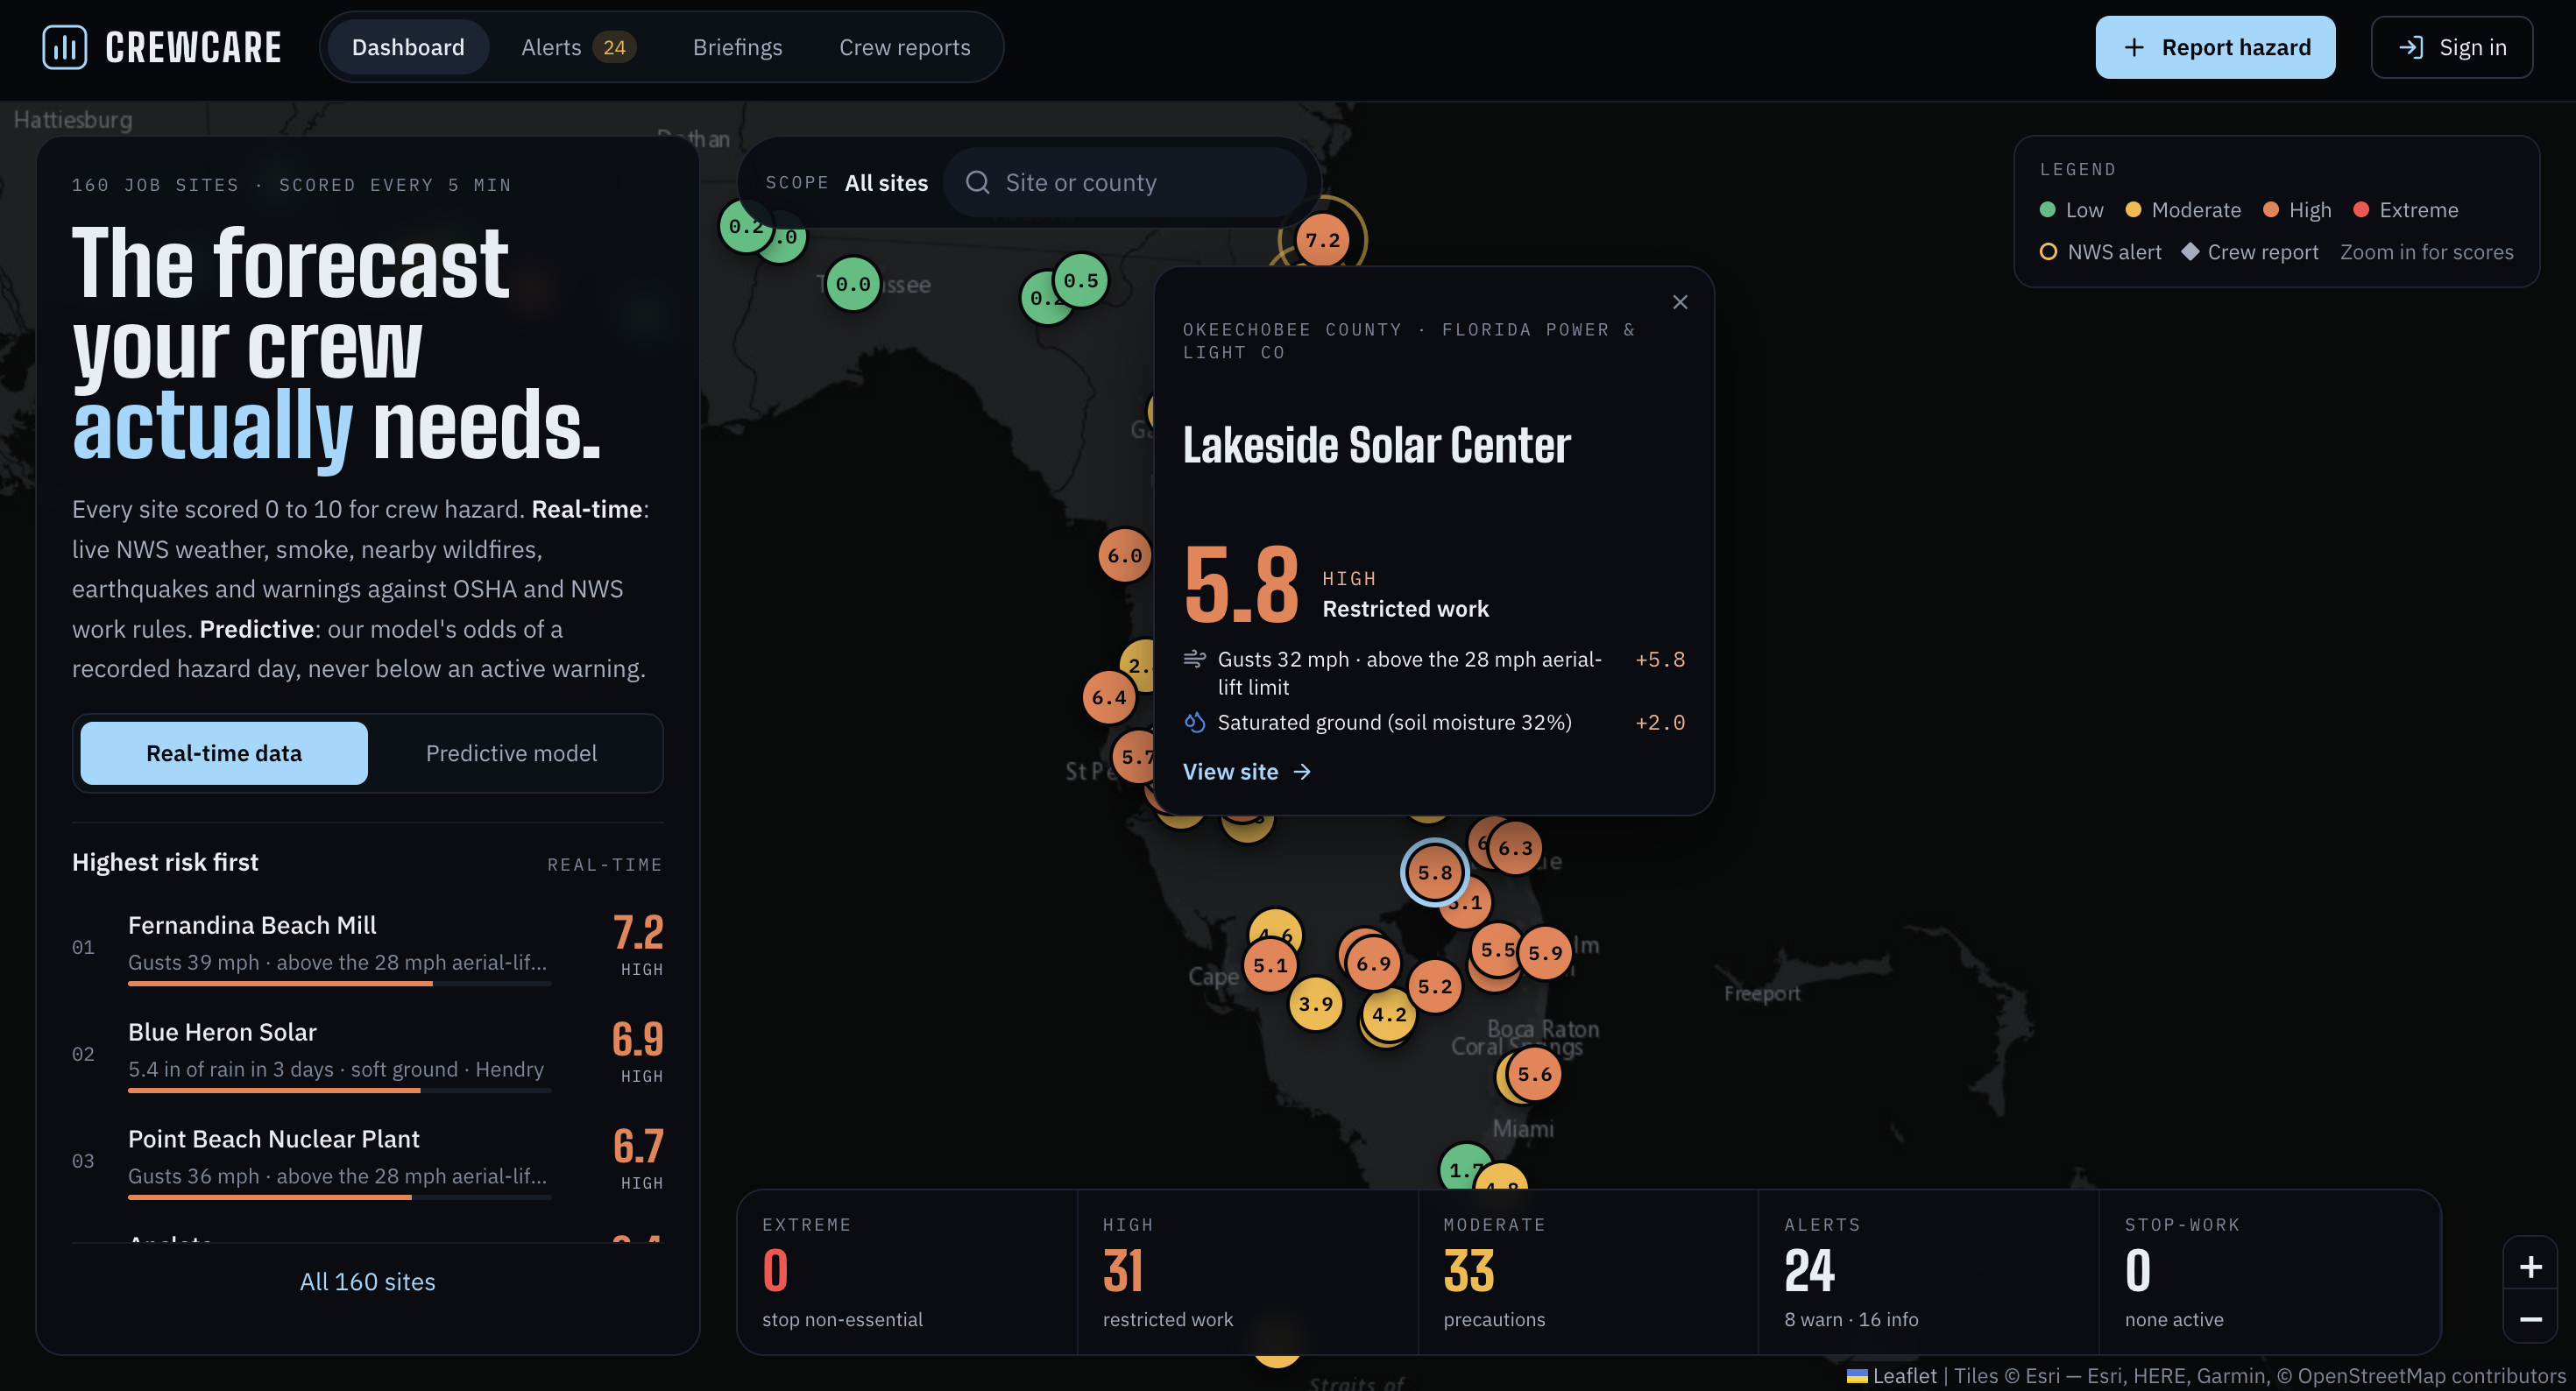
hazard index overview changing the scope to florida and clicking into a specific node
-
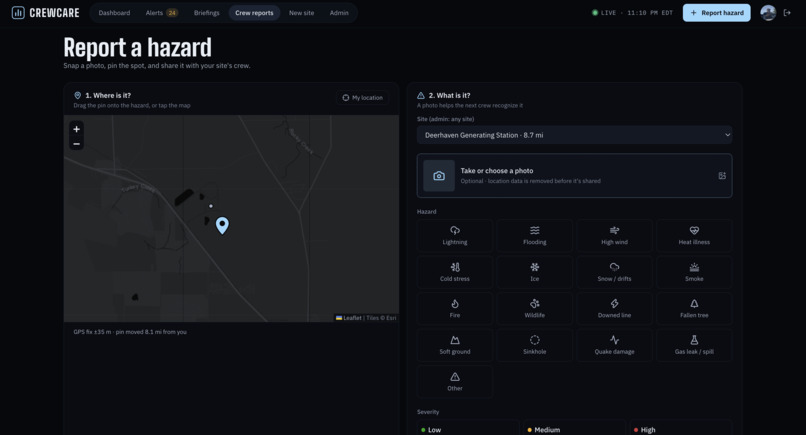
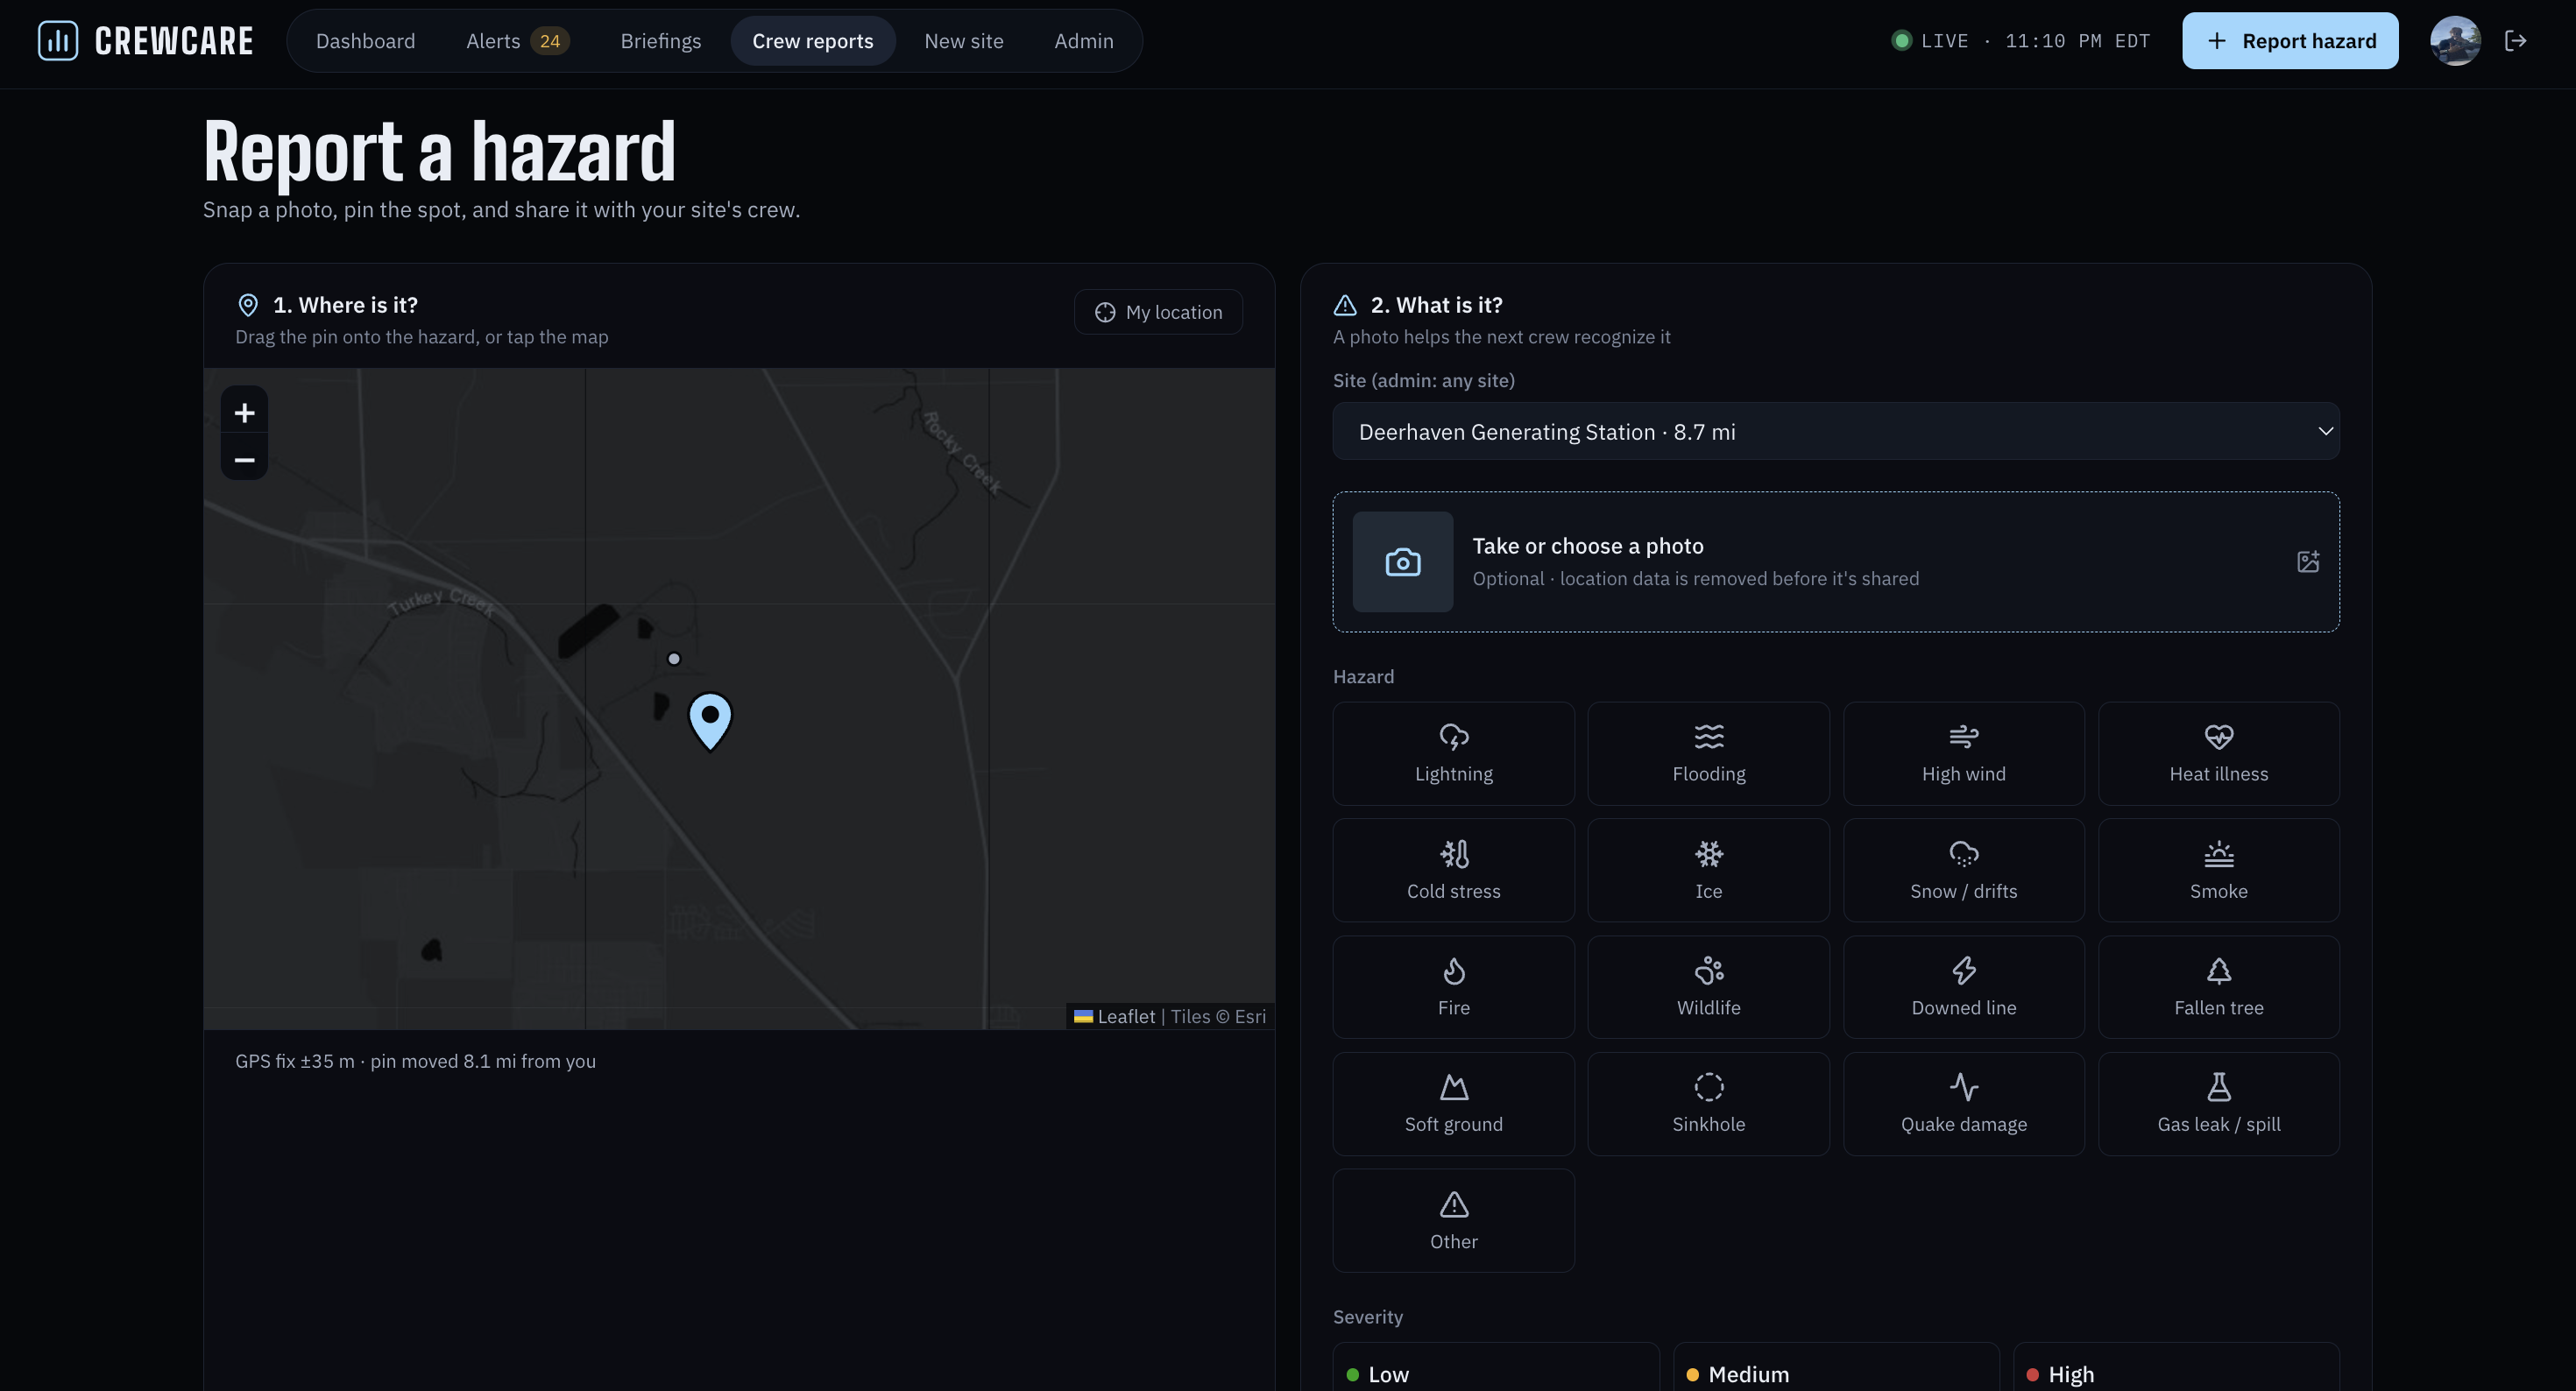
hazard reporting interface for the crew accounts
-
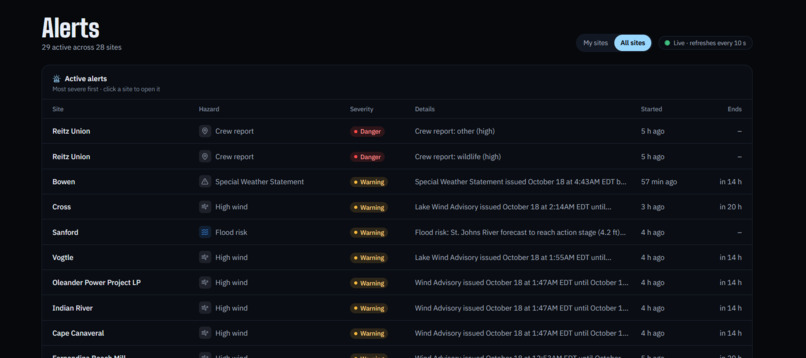
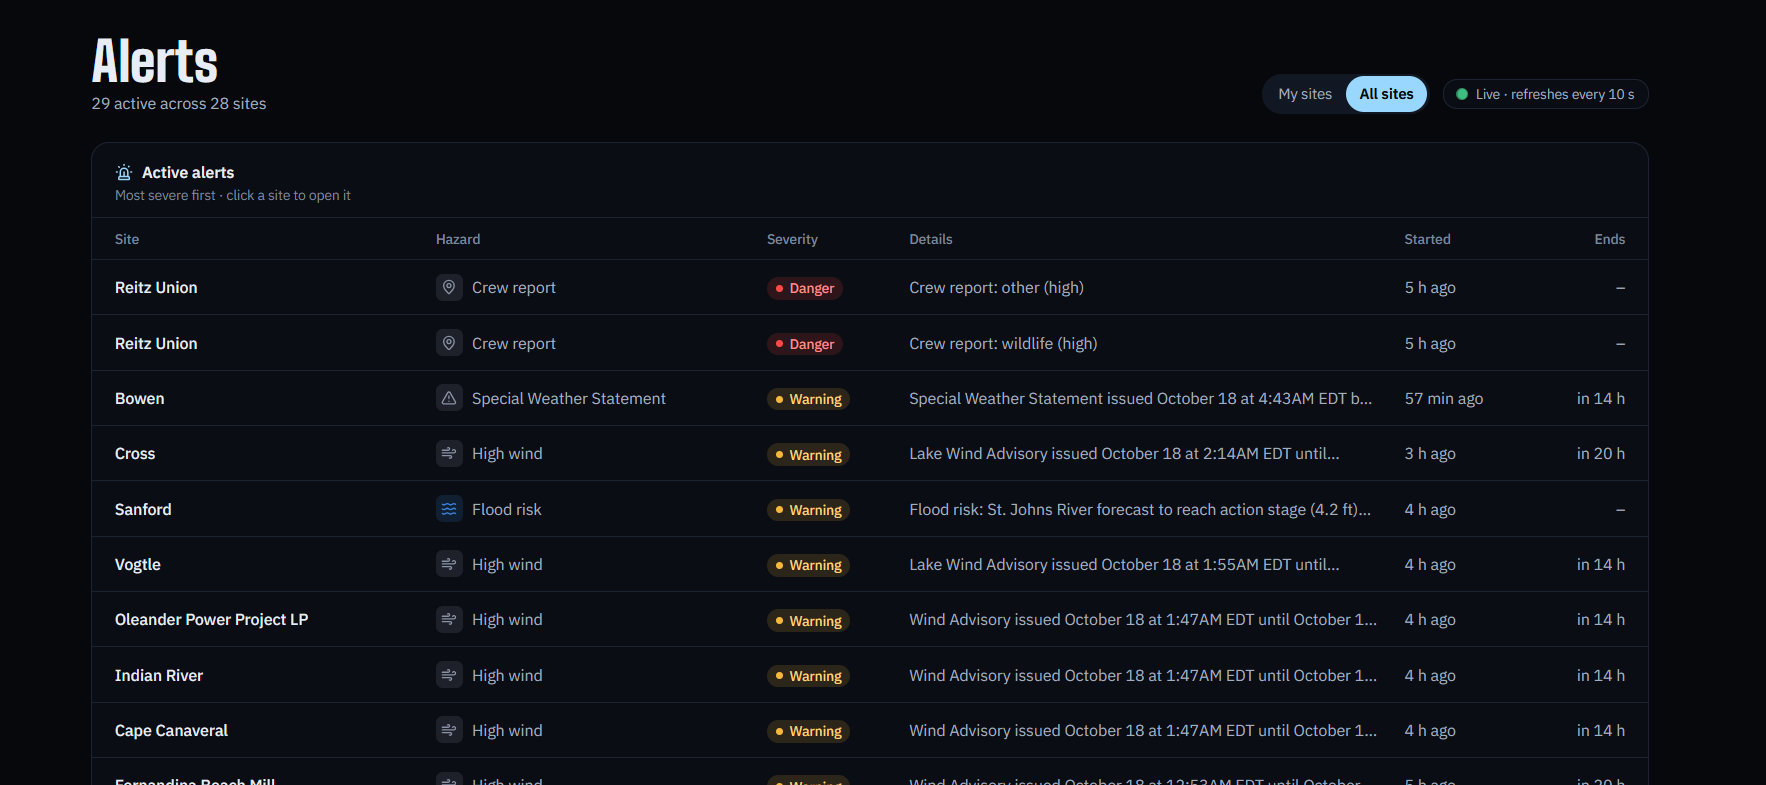
real time alerts (every 10s) generated from weather API calls near job sites
-
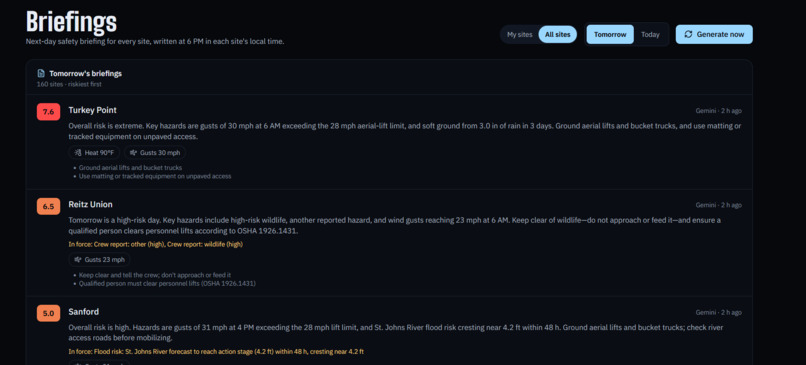
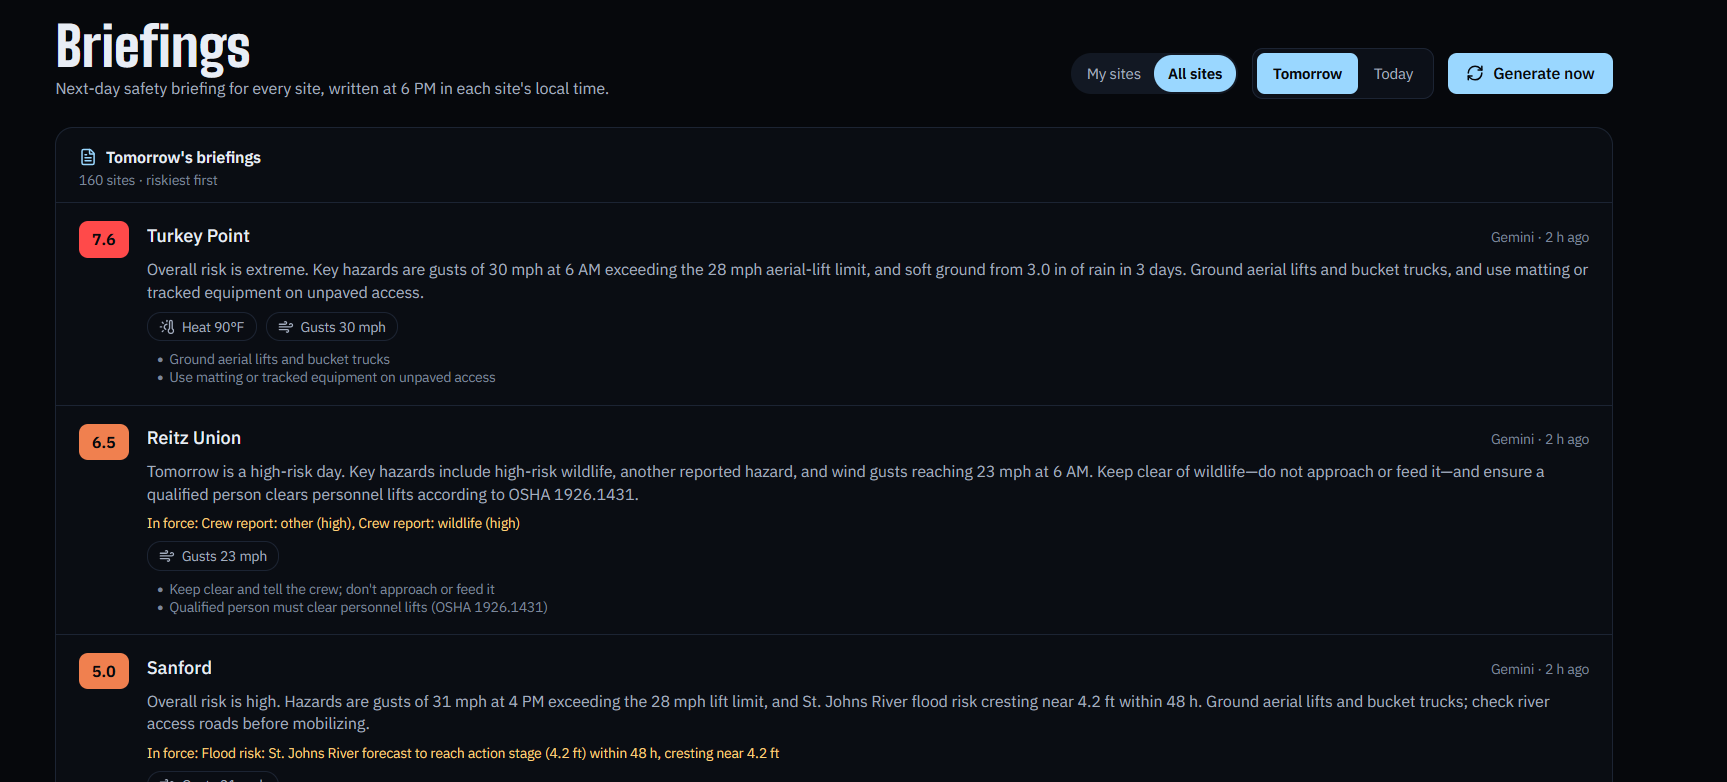
briefings page where managers get daily briefings for the next day
-
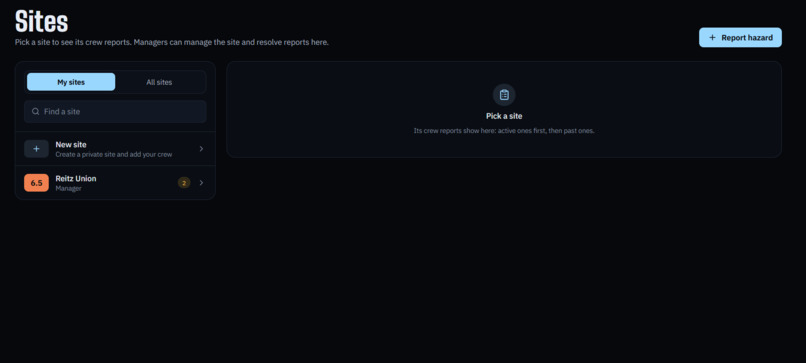
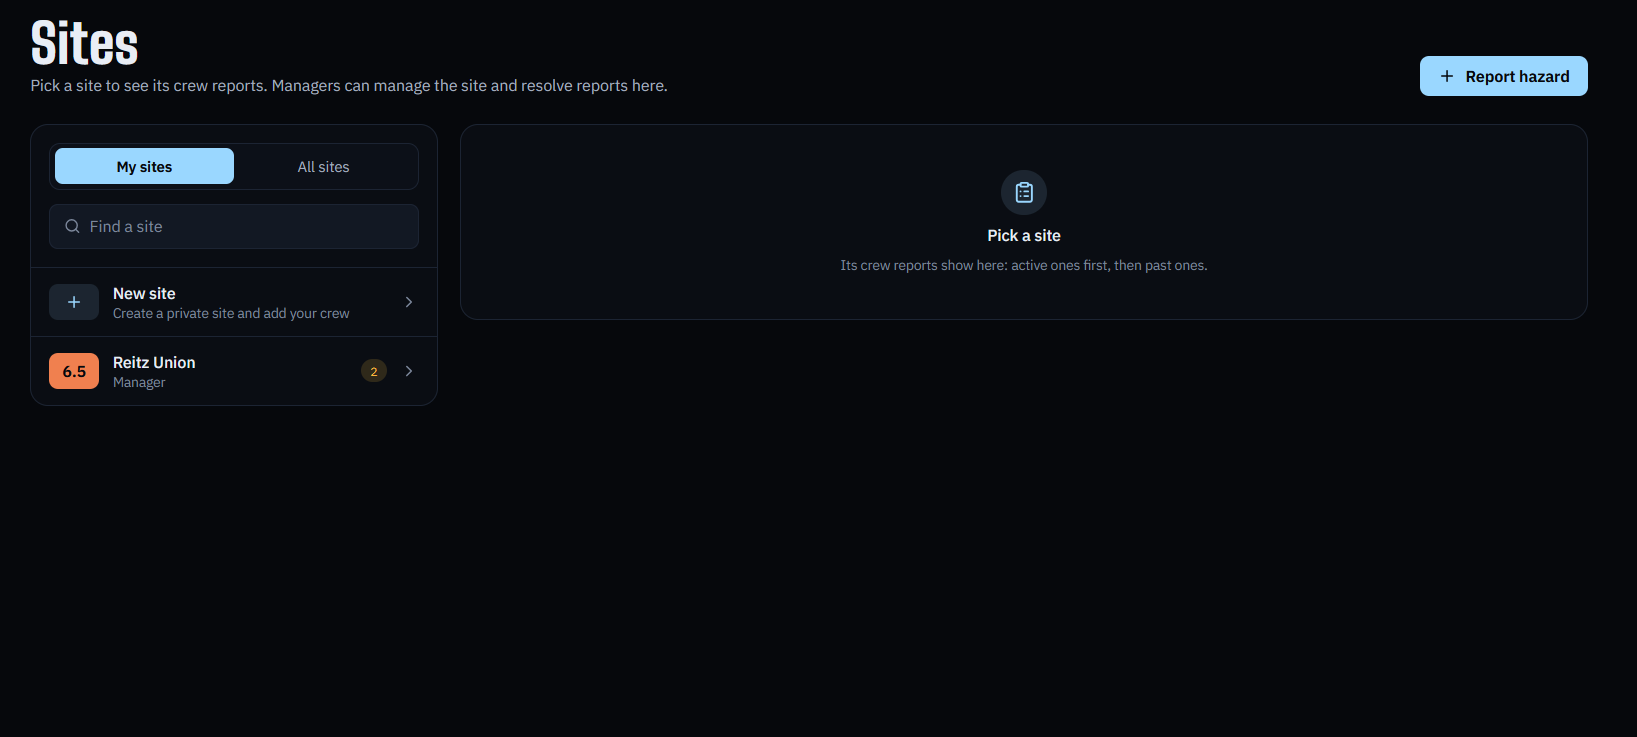
sites page where managers can add new sites/ review current sites and their reports
Inspiration
Every year, hot weather injures about 15,000 workers in California alone, yet only about 850 of those injuries are officially recorded as heat-related. A study of more than 11 million workers' compensation claims found that injury risk climbs 6–9% on days above 90°F and 10–15% above 100°F. And heat is only one hazard: crews also work through lightning, flooded access roads, wind on aerial lifts and ice. The danger is predictable, but it's rarely blamed on the weather, so it's rarely planned for.
Evans dad actually works for NOAA, so using data produced by his dad to create something of his own really spoke to him and drew him to project. Zarraf's parents are civil and construction, so they would literally be the end users for our product.
We had each worked with this kind of data before. Zarraf's senior capstone with KB Signaling used track circuit data to predict where rail track would need drainage maintenance, and taught us how inconsistent weather sources can be, and that drawing on several sources is the best fail safe. Evan had worked with large datasets in MariaDB, which shaped how we designed our time-series database. When we read the Sperry Tech challenge, which job sites are dangerous for field crews today, and tomorrow?, we wanted to bring that experience with data, databases and ML to it.
What it does
CrewCare gives each of 160 US power plants (EIA-860M, all 50 states) a live 0–10 hazard score, now and for the next 24 hours. The four levels run from low (normal operations) to extreme (stop non-essential work). Each site page lists the top factors behind its score, each with an action, such as "Ground aerial lifts and bucket trucks" when gusts pass 28 mph. Any lightning flash within 10 miles starts a stop-work countdown. Managers get a 6 PM briefing on tomorrow's work day, crews report hazards from their phones using GPS, and a manager can add any job site in the US and have it scored within a minute.
Why two scores?
| Real-time | Predictive | |
|---|---|---|
| Asks | Do conditions break a work rule right now? | How likely is this to become a real hazard day? |
| Built from | OSHA and NWS thresholds, live warnings, lightning, fires, quakes | XGBoost trained on 138,860 site-days of weather history |
| Best at | Wind (92% of wind days caught vs 80%), hurricanes (96% vs 93%), sudden events | Heat (92% vs 63%), winter (82% vs 56%), floods (80% vs 46%), storms (77% vs 51%) |
| Use it for | The call on site: stop work, ground the lifts, wait out the lightning | Planning: which sites need extra precautions or a different crew tomorrow |
The rules are exact but only fire once a threshold is crossed; the model sees combinations no single rule trips, like heavy rain on already soaked ground. During a North Dakota arctic outbreak, Real-time said 5.3 and Predictive said 9.3, and Predictive never drops below an active NWS warning.
How we built it
We built one row per site per day: that day's weather (3.3M hourly Open-Meteo rows), labeled with whether a hazard actually happened. A day counts as a hazard day if NOAA Storm Events logged a crew-relevant event (storm, flood, heat, tropical, wind, cold, winter, wildfire, dust) within 25 miles or in the site's county. That gave us 138,860 site-days, 5.1% of them hazard days.
The Predictive score is 300 gradient-boosted decision trees. Each tree is a short chain of yes/no questions about the weather, fitted to the errors of the trees before it, and the prediction adds up every tree's leaf score:
$$\hat{p} = \sigma!\left(\sum_{k=1}^{300} f_k(\mathbf{x})\right), \qquad \sigma(z) = \frac{1}{1+e^{-z}}$$
We compared logistic regression, random forest, gradient boosting and XGBoost on identical inputs. Better inputs (snowfall, wind chill, location) lifted every model by about 0.04 ROC-AUC, while switching between tree models moved it by under 0.01. XGBoost beat logistic regression by 0.081 ROC-AUC (95% CI 0.071–0.091), because hazards are thresholds and interactions, like heavy rain on saturated ground, which is exactly what tree splits capture. XGBoost also handles missing values and gives exact per-row SHAP (Shapley value) contributions, so every score can explain itself.
The Real-time score rates each hazard 0–10 against a published OSHA or NWS rule, then combines the worst kind of hazard with a quarter of the second and a tenth of the third, counting each extra only if it's 5 or more on its own:
$$S = \min\left(10,\; h_1 + 0.25\,h_2 + 0.10\,h_3\right)$$
A Python worker polls every source and rescores every site every 5 minutes. A FastAPI backend serves the app, and the two share only the database: Tiger Data (Postgres with TimescaleDB and PostGIS), with hypertables for weather, lightning and scores, a continuous aggregate for the daily features, and ST_DWithin for strikes near a site. The frontend is Next.js 16 with Auth0 login, all on one Vultr server. Gemini writes the 6 PM briefings, and we keep a summary only if every number in it appears in the facts we gave it.
How we tested it
Hazard days are rare (5.1%), so plain accuracy is misleading: a model that always said "safe" would be 95% accurate. We used leave-one-year-out cross-validation, scoring each year with a model trained only on the others. Confidence intervals come from a cluster bootstrap that resamples whole sites (500 resamples), because days at the same site aren't independent.
- Discrimination: ROC-AUC 0.883 (95% CI 0.876–0.890), stable across held-out years (0.868, 0.892, 0.881). By the Mann–Whitney U statistic, that is the probability a random hazard day outranks a random normal day:
$$\text{AUC} = \frac{U}{n_1 n_0} = \Pr\left(s_{\text{hazard}} > s_{\text{normal}}\right)$$
- Rare-event detection: PR-AUC 0.312, 6.1× the 5.1% base rate (95% CI 5.6–6.6×). At "high" or above, recall is 77.8% (95% CI 75.8–79.7%) at 17.9% precision.
- Calibration: Brier score 0.0399 against 0.0485 for climatology (Brier skill score 0.18), with a calibration slope of 1.03 (1.0 is perfect). Hosmer–Lemeshow still rejects perfect calibration (χ² = 59.5, df = 8): at n = 138,860 it detects even a slight over-prediction on calm days.
- Dose-response: a Cochran–Armitage trend test across the four levels gives z = 129. Extreme days were 55× as likely as low days to be real hazard days.
- Two scores, tested: Predictive beats Real-time by 0.18 ROC-AUC (95% CI 0.17–0.19). Exact McNemar tests on paired hazard days show it catches significantly more storm, flood, heat, winter and cold days (all p < 10⁻⁵), while Real-time catches significantly more wind days (p = 3 × 10⁻⁶). Tropical (p = 0.11) and fire/dust (p = 0.4) are statistical ties.
Challenges we ran into
Uneven labels and disagreeing sources. NOAA offices log events more or less thoroughly, and weather sources disagree: Open-Meteo's "feels like" temperature is not the NWS heat index. Following the capstone's lesson, we never lean on one feed. The model reads the same source live that it was trained on, Real-time uses NWS observations, and floors from NWS warnings and OSHA's heat rule sit on top, so a gap in the labels can never talk a crew out of a real warning.
Two scores, one scale. A rule severity and a model probability meant different things until we matched their odds. We fitted an isotonic regression of how often each Real-time score turned out to be a real hazard day, then gave each probability the Real-time score with the same odds:
$$r(s) = \Pr[\text{hazard day} \mid \text{Real-time score} = s], \qquad \text{Predictive}(p) = r^{-1}(p)$$
Now a level means the same on both: "moderate" days were real hazard days 4.2% of the time on Predictive and 4.3% on Real-time.
Live data for 160 sites on free tiers. Open-Meteo allows 10,000 calls a day, so the history backfill paces itself and live polling stays around 1,800 calls a day. We fetch every NWS warning in one national request every 2 minutes, and check every GOES lightning flash against every site as the files land every 20 seconds.
Accomplishments that we're proud of
- Two hazard indexes, not one. The brief asked for a single ML score; we paired it with a rule-based Real-time score on the same scale, and showed statistically where each one wins.
- 88% ranking accuracy on years it never saw. It picks the real hazard day over a normal one 88.3% of the time (ROC-AUC 0.883, 95% CI 0.876–0.890).
- Sharpest where the risk is highest. Days it rated extreme were 55× as likely to be real hazard days as days it rated low, and Hurricanes Idalia, Helene and Milton all scored a full 10.0.
- Honest odds. On the days it gave about a 27% chance of danger, 29% turned out dangerous.
- One model for all 50 states. It covers 160 power plants and scores any new US address in about a minute, with no retraining.
- Storms flagged before they form. Real-time reads live storm energy (CAPE) from Open-Meteo every 3 hours and weighs it by the chance of rain. It starts counting at 1,000 J/kg and reaches 5 out of 10 at 3,500 J/kg, and from moderate up it tells crews to "Watch radar; plan shelter for afternoon storms." Each site page shows the current CAPE.
- Beyond the brief. Live satellite lightning from GOES-East and GOES-West every 20 seconds, smoke, earthquakes, about 50 NWS warning types, Auth0 roles, private job sites, phone push alerts, and crew reports allowed only within 5 miles of the site.
What we learned
- Inputs matter more than the model. Better features moved every model; switching models barely moved any of them.
- Rules and models fail in different places. The McNemar tests proved it, so we show both instead of picking one.
- Significance isn't the same as size. With 138,860 days, even tiny effects test significant, so we report confidence intervals and effect sizes, not just p-values.
What's next for CrewCare
- Longer history, including storm energy (CAPE): we trained on two years outside Florida and three inside it, all we could backfill in the time we had.
- Photo verification: check crew report photos with an image model (another AI endpoint or a CNN).
- Offline mode: cache scores, briefings and reports on crew and manager devices for sites that lose their connection.
Live demo: https://crewcare.207-246-119-236.sslip.io/
Built With
- auth0
- gemini
- next.js
- noaa
- open-meteo-forecast
- postgis
- postgresql
- python
- react-native
- scikit-learn
- scipy
- tiger-data
- timescaledb
- typescript
- vultr
- xgboost


Log in or sign up for Devpost to join the conversation.