-
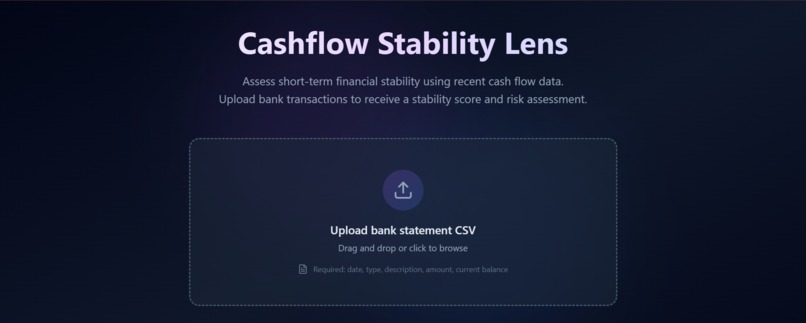
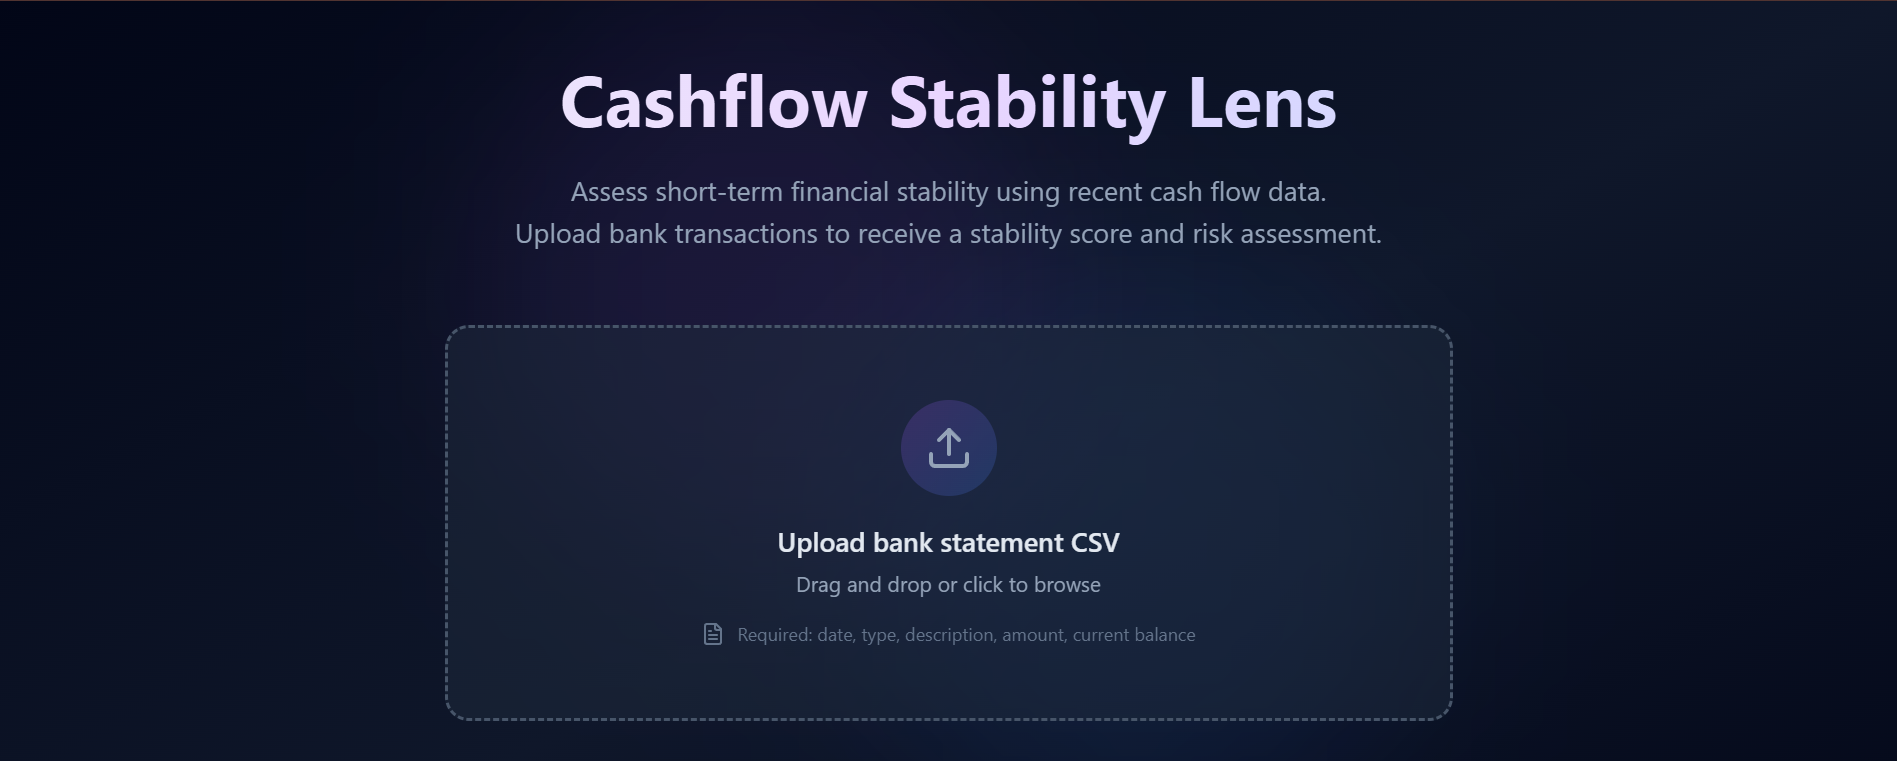
Upload page
-
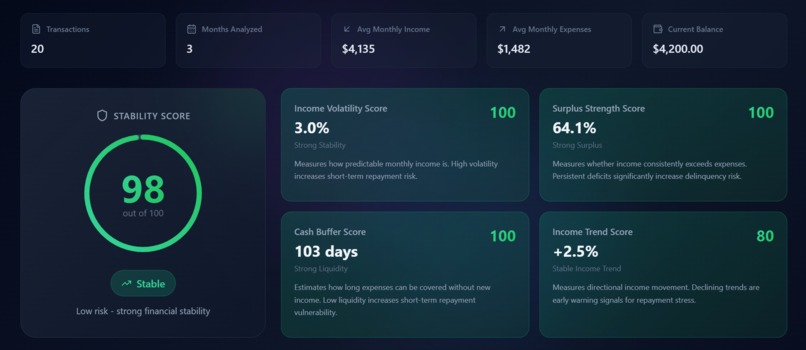
Analytics
-
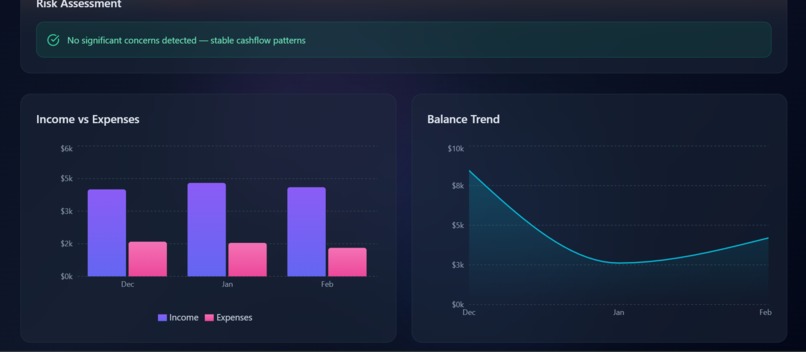
Graphs
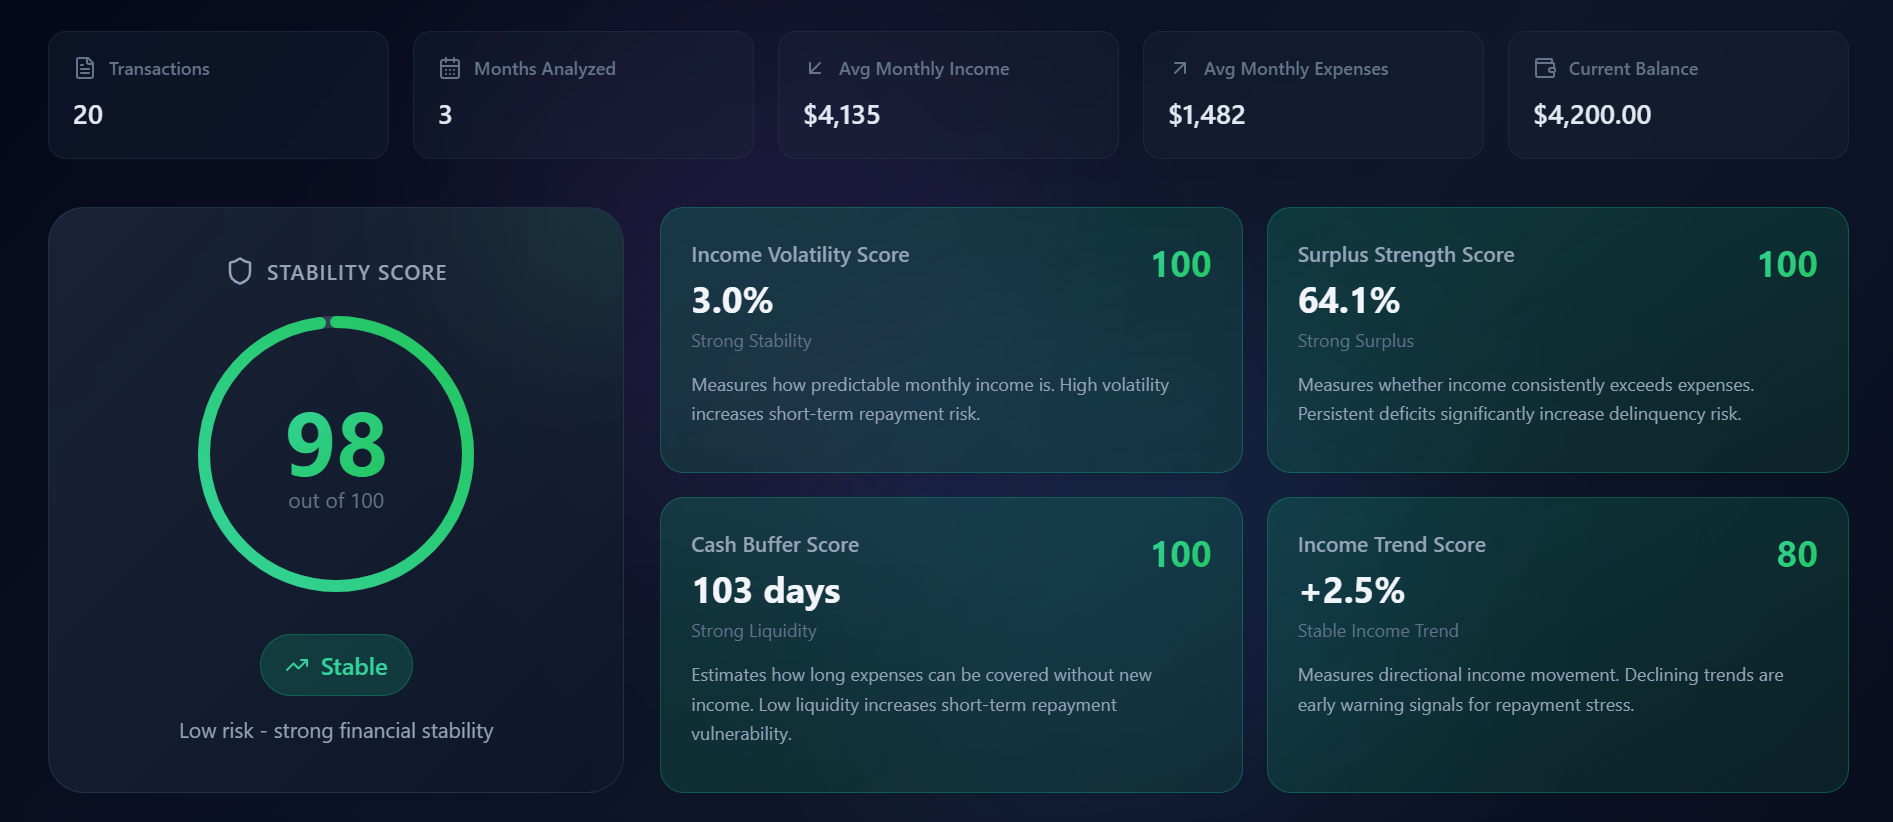

Cashflow Stability Lens
Inspiration
During Divya's internship at Amex last summer, she learnt how much underwriting could gain from looking at real cash flow instead of static snapshots. We wanted a tool that gives lenders a short-term view of financial behavior through income consistency, spending vs. income, cash buffer, and trend so that "Can this person repay in the next few months?" is easier to answer. Cashflow Stability Lens started from that: turn a bank-statement CSV into a stability score and risk tier in seconds.
What it does
Short-term stability scoring for credit underwriting. Upload a bank-statement CSV; the app runs fully in the browser (no data sent to servers) and returns a 0–100 Stability Score, risk tier (Stable / Watch / Risky), four component metrics (income volatility, surplus ratio, cash buffer days, income trend), risk flags, and income/expense/balance charts. This app is customized for a fictional bank called Capital Pack, so the bank statements are expected to be in the specific format they use.
How We Built It
Stack: React 18, Vite, Tailwind, Framer Motion, Recharts.
We built a custom JavaScript metrics engine that parses uploaded CSV transaction data, groups activity by month, computes core financial indicators, and outputs a composite stability score in a local-only environment for privacy.
To meaningfully assess short-term financial stability, we focused on four signals: income consistency, spending surplus, liquidity cushion, and income trajectory. Together, these capture volatility risk, sustainability, and resilience.
Metrics
Income Volatility (Coefficient of Variation):
$$ CV = \frac{\sigma_{\text{income}}}{\mu_{\text{income}}} $$
This measures how unpredictable income is relative to its average, penalizing irregular cash flow.
Surplus Ratio:
$$ SR = \frac{\mu_{\text{income}} - \mu_{\text{expenses}}}{\mu_{\text{income}}} $$
This shows what percentage of income remains after covering expenses, reflecting financial sustainability.
Cash Buffer Days:
$$ CBD = \frac{\bar{B}}{\mu_{\text{expenses}} / 30} $$
This estimates how many days of expenses can be covered using the average account balance, representing liquidity strength.
Income Trend:
$$ T = \frac{I_{\text{last}} - I_{\text{first}}}{I_{\text{first}}} $$
This captures whether income is growing or declining over time, signaling momentum risk.
Stability Score
$$ \text{Stability} = 0.30 S_{\text{vol}} + 0.30 S_{\text{surplus}} + 0.30 S_{\text{buffer}} + 0.10 S_{\text{trend}} $$
Each metric is normalized to a 0–100 scale and combined into a weighted composite score that prioritizes consistency, surplus generation, and liquidity, with additional weight for income trajectory.
No backend is required; all processing occurs locally in the browser to preserve user privacy. The system includes strict CSV validation and guided re-upload flows to ensure clean, reliable analysis.
Challenges we ran into
- Windows setup:
npm installissues (ENOTEMPTY, long paths) and broken packages (caniuse-lite, lucide-react, lodash). Fixed by reinstalling those packages and configuring other installations. - Standalone run: App was built on Base44; we rewrote auth/config to run on localhost with a small local client and no external APIs.
Accomplishments we're proud of
- Transparent, auditable formula and four sub-metrics.
- Robust CSV handling: validation, bolded missing-column errors, same-file re-upload.
- One-page flow: upload → score → flags → charts.
- Robust README with tons of relevant information
What we learned
- Clear, explainable metrics and visuals make it easier for non-technical teams to trust and use a tool.
- Consistent formatting of input data makes analysis much more reliable.
- Testing with realistic sample data exposes issues you wouldn’t notice otherwise.
What's next
- Customizable Analysis window: "Last 90 days" / "last 6 months" / "all data."
- Current liquidity: Use latest-month balance for cash buffer.
- More metrics: Calculating additional metrics such as debt burden ratio and spending volatility for greater detail.
- Export: PDF/CSV of score and flags for underwriting and compliance.
- Optional API: Backend for storing scores, batch runs, and integrations.
- More flexibility: CSVs don't have to be uploaded in a strict format, it parses data as it is and makes adjustments.
Built With
- css
- date-fns
- framer-motion
- javascript
- jsx
- lucide-react
- node.js
- radix-ui
- react
- recharts
- vite

Log in or sign up for Devpost to join the conversation.