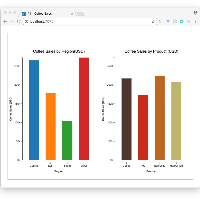
In this project, I create two bar charts on the same web page. The bar charts show the total coffee sales for a chain of coffee shops. The first bar chart shows the total sales per region (i.e. Central, West, East, South). The second bar chart shows the total sales per product category (i.e. Coffee, Tea, Espresso, Herbal Tea). I need to aggregate the data for the region and category data attributes and then compute the total sales.
Create a Static Visualization
In this project, I create two bar charts on the same web page. The bar charts show the total coffee sales for a chain of coffee shops.
Updates

Leave feedback in the comments!
Log in or sign up for Devpost to join the conversation.