Inspiration
Every big cricket chase has that moment — a required run rate creeping past the current one, a batter needing to decide whether to accelerate or survive. Broadcast win predictors show you a number, but they never let you test the moment. What if that dot ball had been a six? What if the previous over had gone for two more runs? We wanted a dashboard that didn't just report a chase, but let you argue with it — rewrite a ball, and watch the odds recompute in front of you.
We also noticed that almost every cricket stats page ranks players the same way: total runs, total wickets, career strike rate. None of them answer the question that actually decides matches — who performs better when the pressure is on, and who fades? That became the second pillar of the project: a Clutch Index that isolates high-pressure deliveries and measures the swing in performance, rather than just the average.
What it does
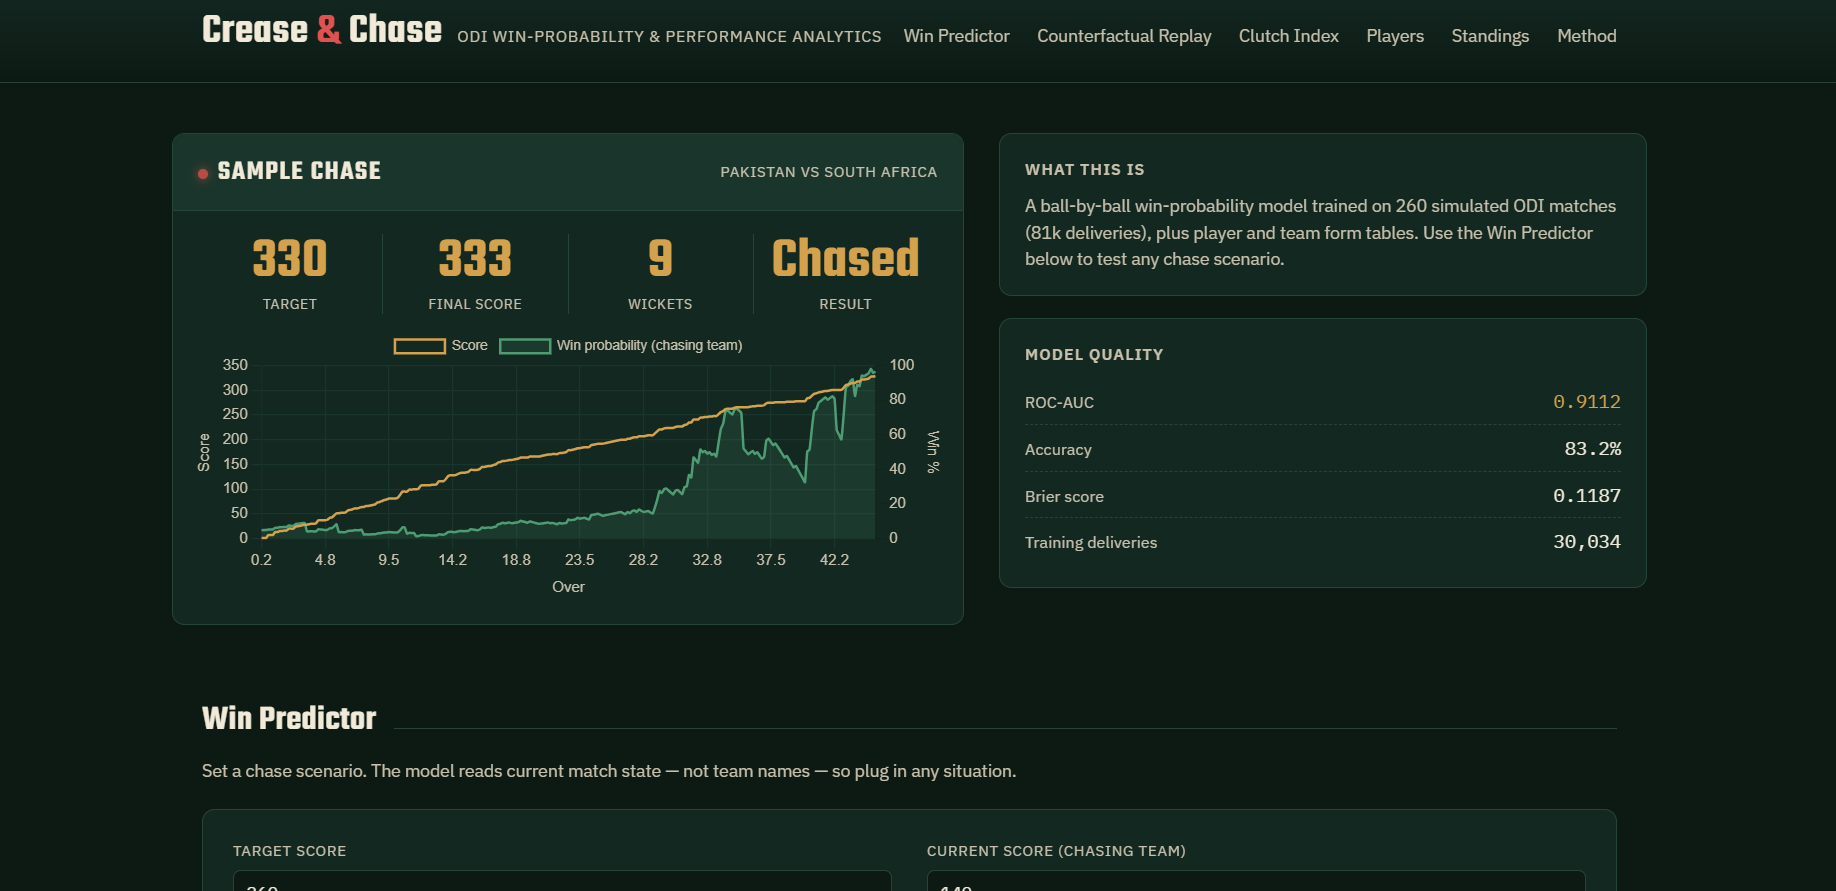
Crease & Chase is a ball-by-ball cricket analytics dashboard built around a win-probability model, with two features we hadn't seen combined anywhere else:
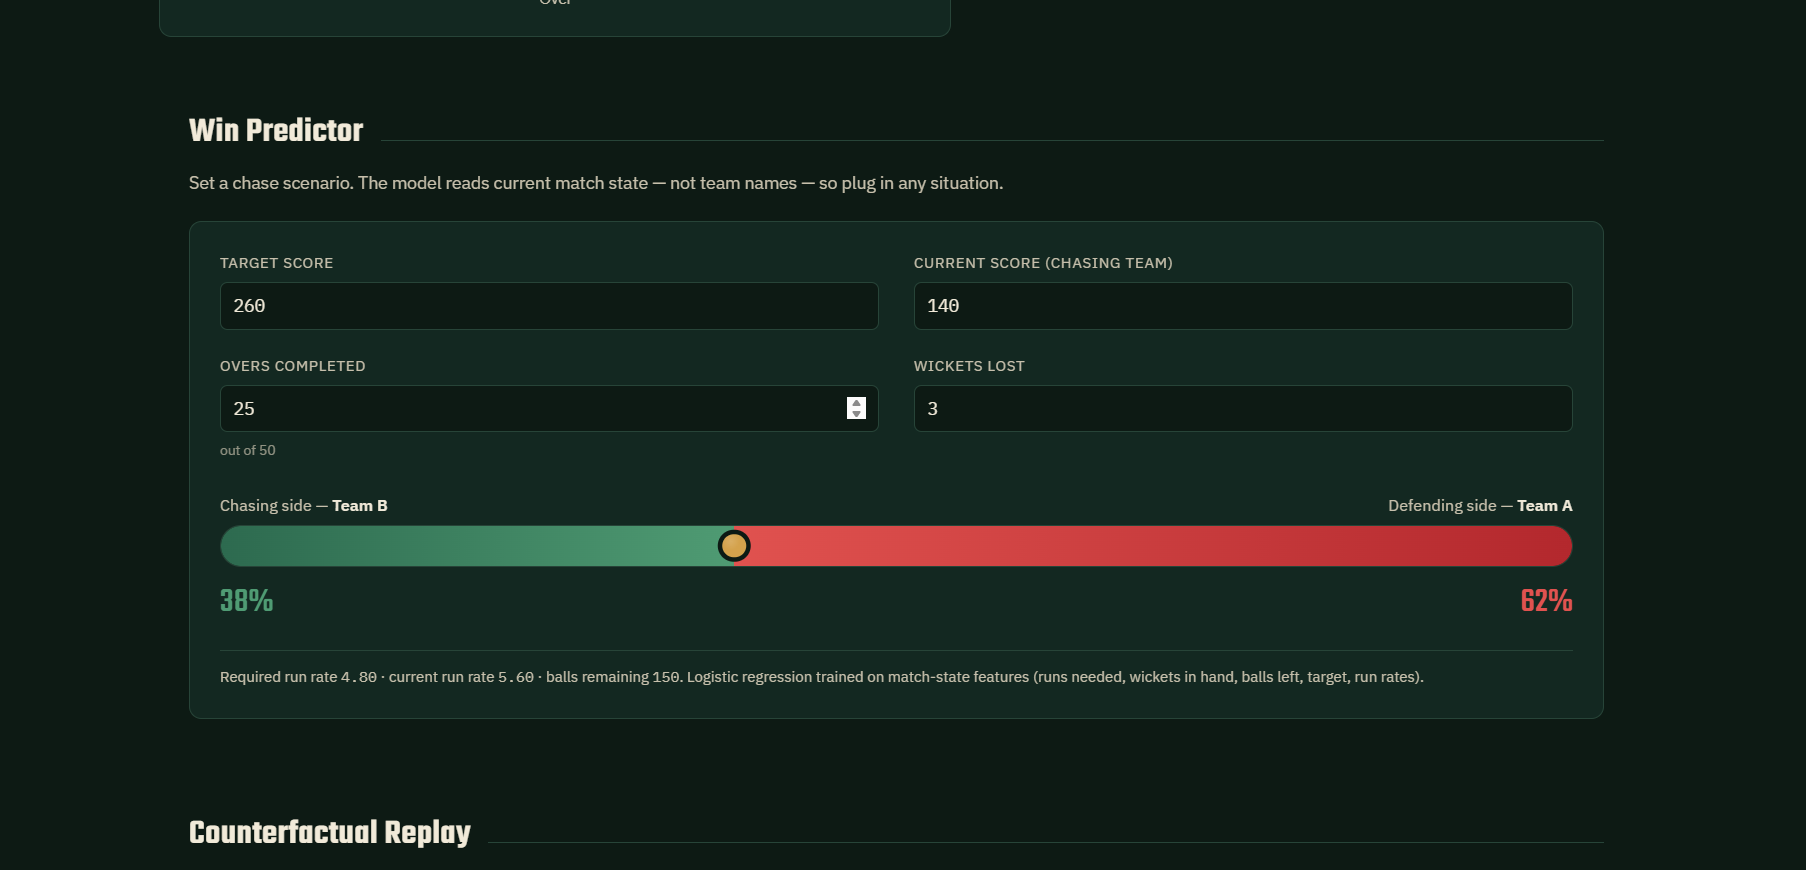
- Win Predictor — enter any chase scenario (target, score, overs, wickets) and get a live win probability for both teams.
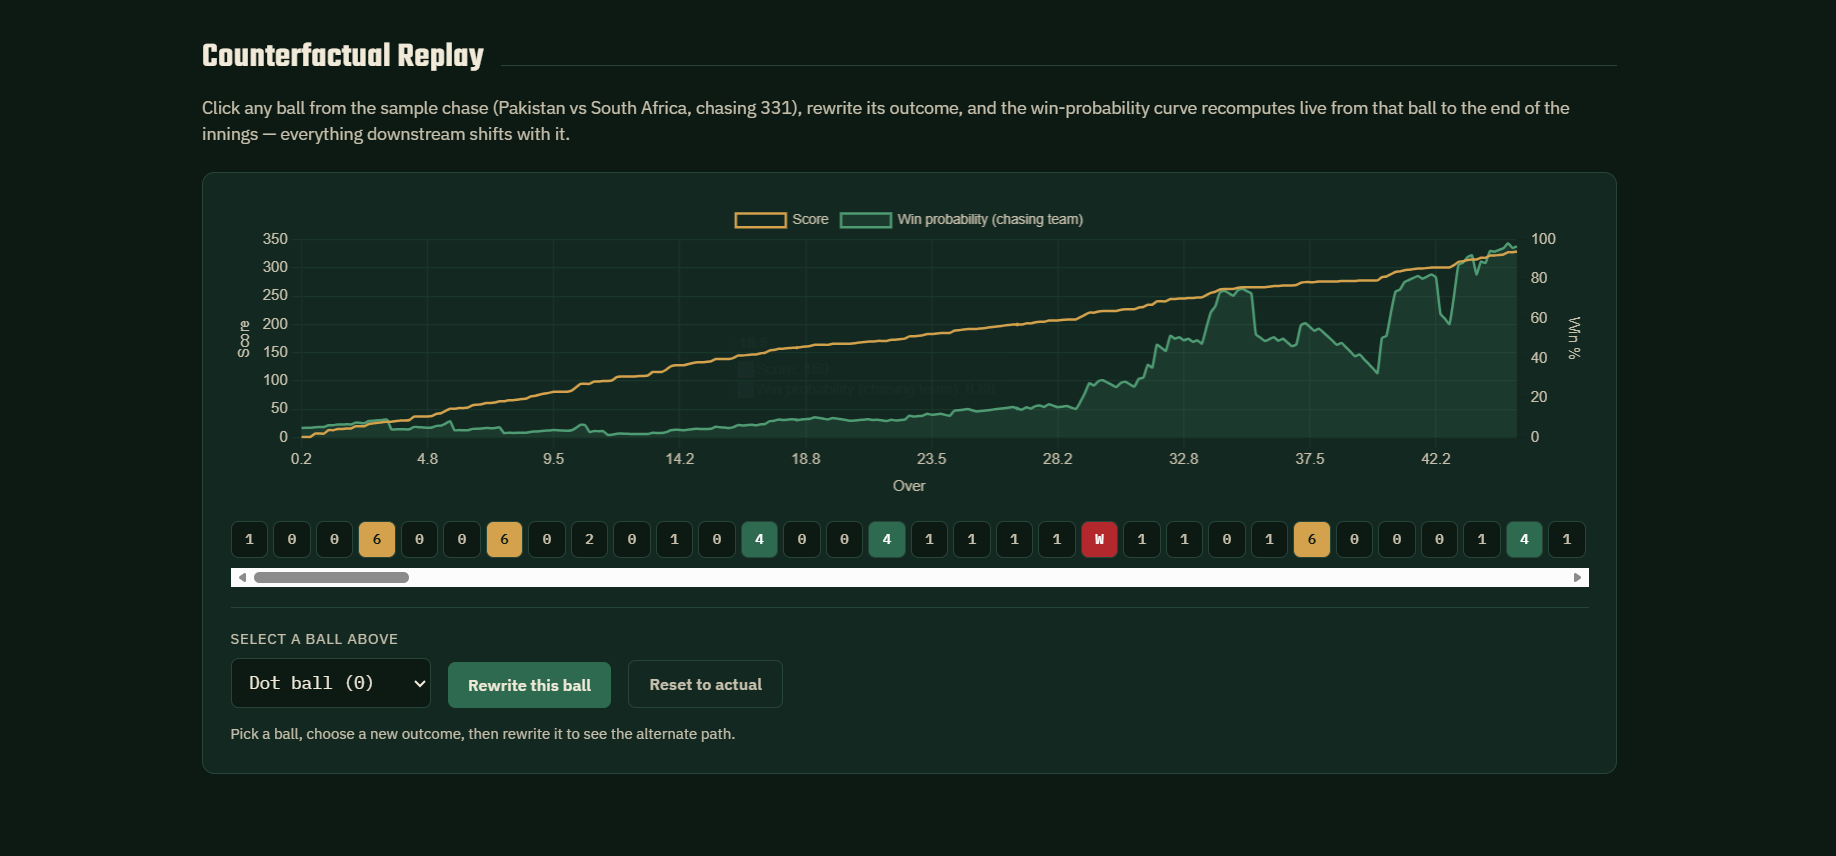
- Counterfactual Replay — click any ball in a sample match, rewrite its outcome, and watch the win-probability curve recompute for every ball that follows.
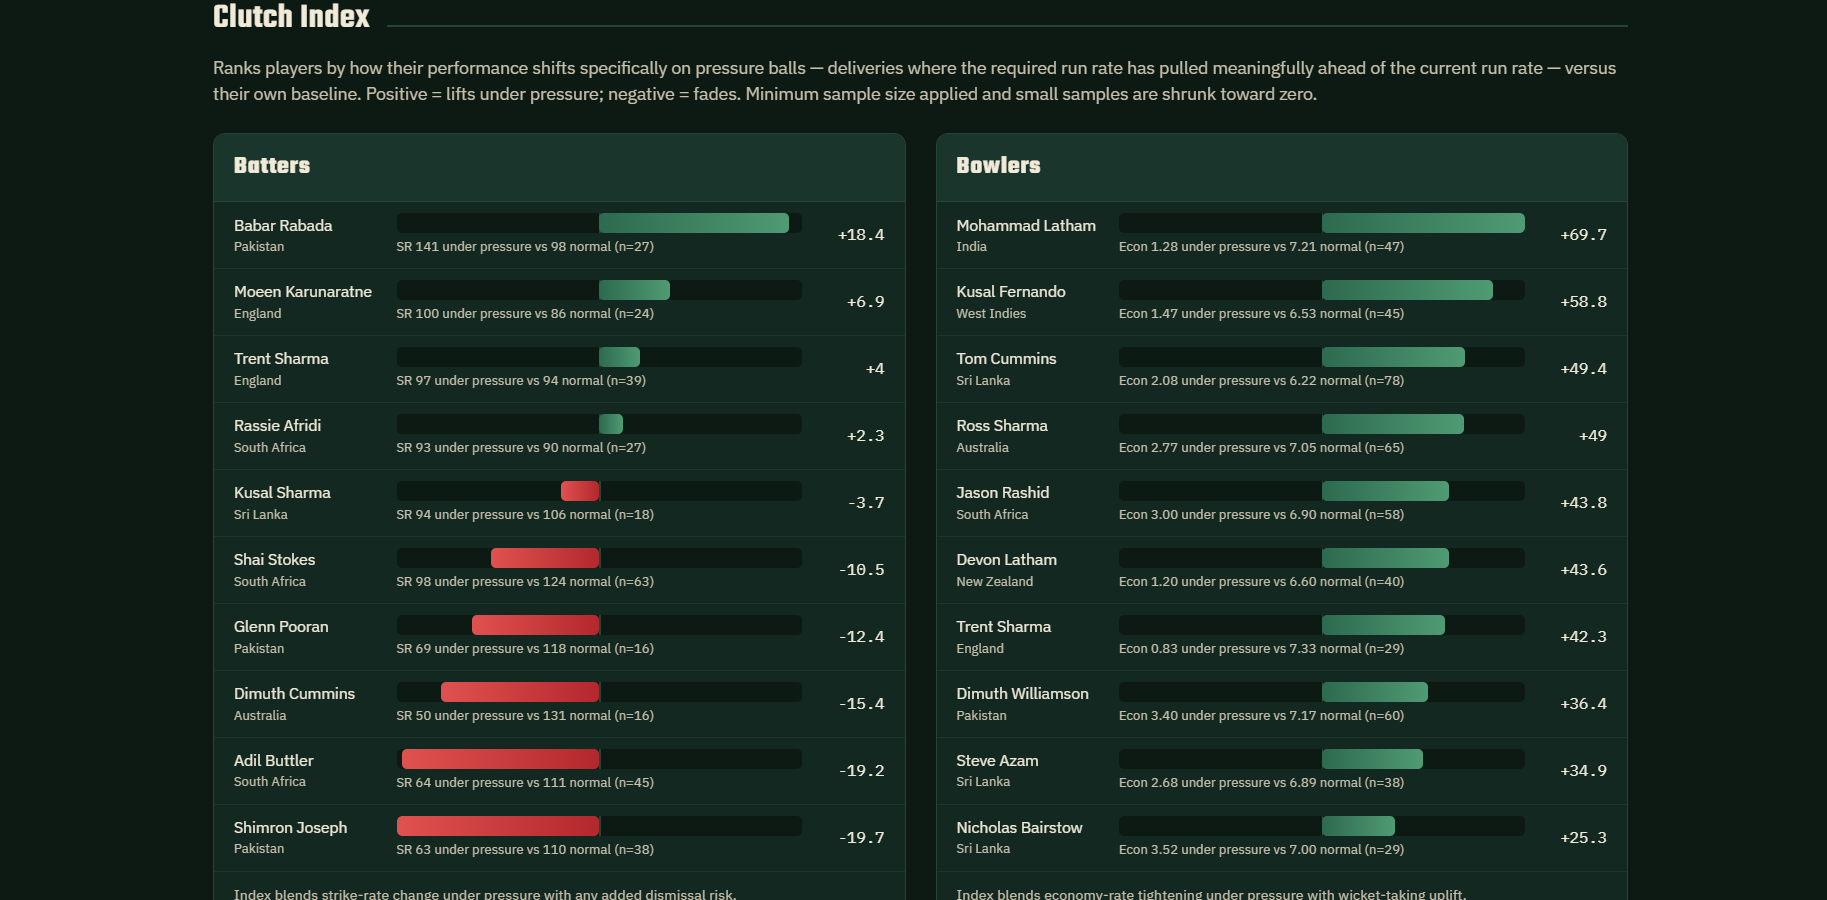
- Clutch Index — a leaderboard ranking batters and bowlers by how much their performance shifts specifically on high-pressure deliveries, versus their own baseline.
How we built it
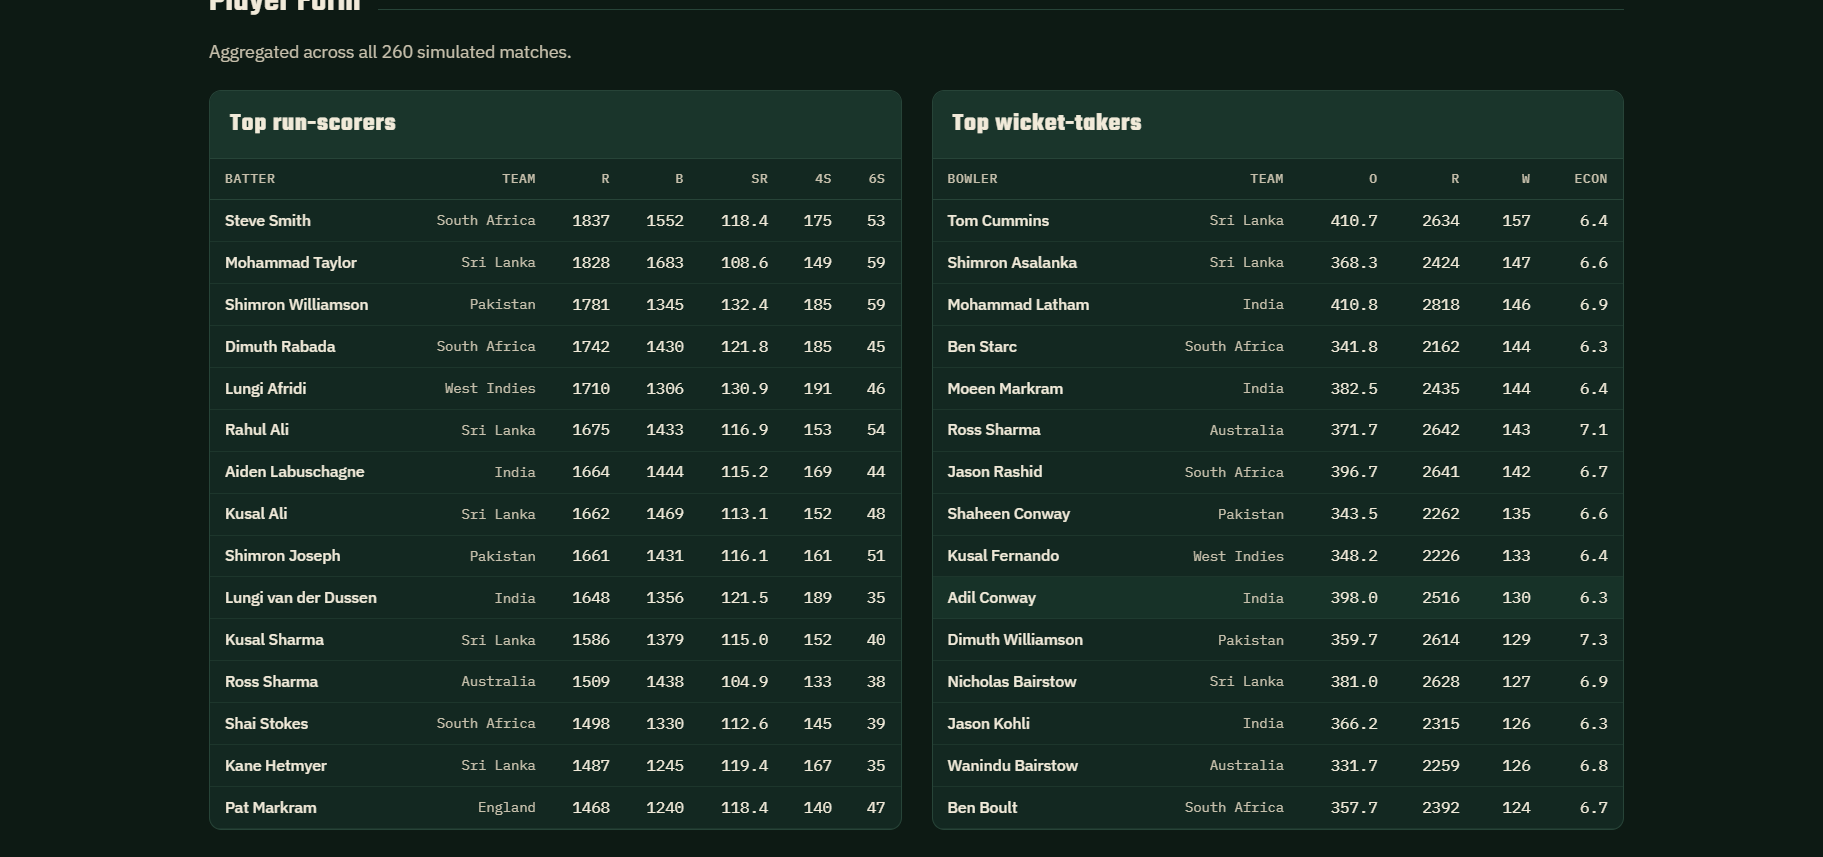
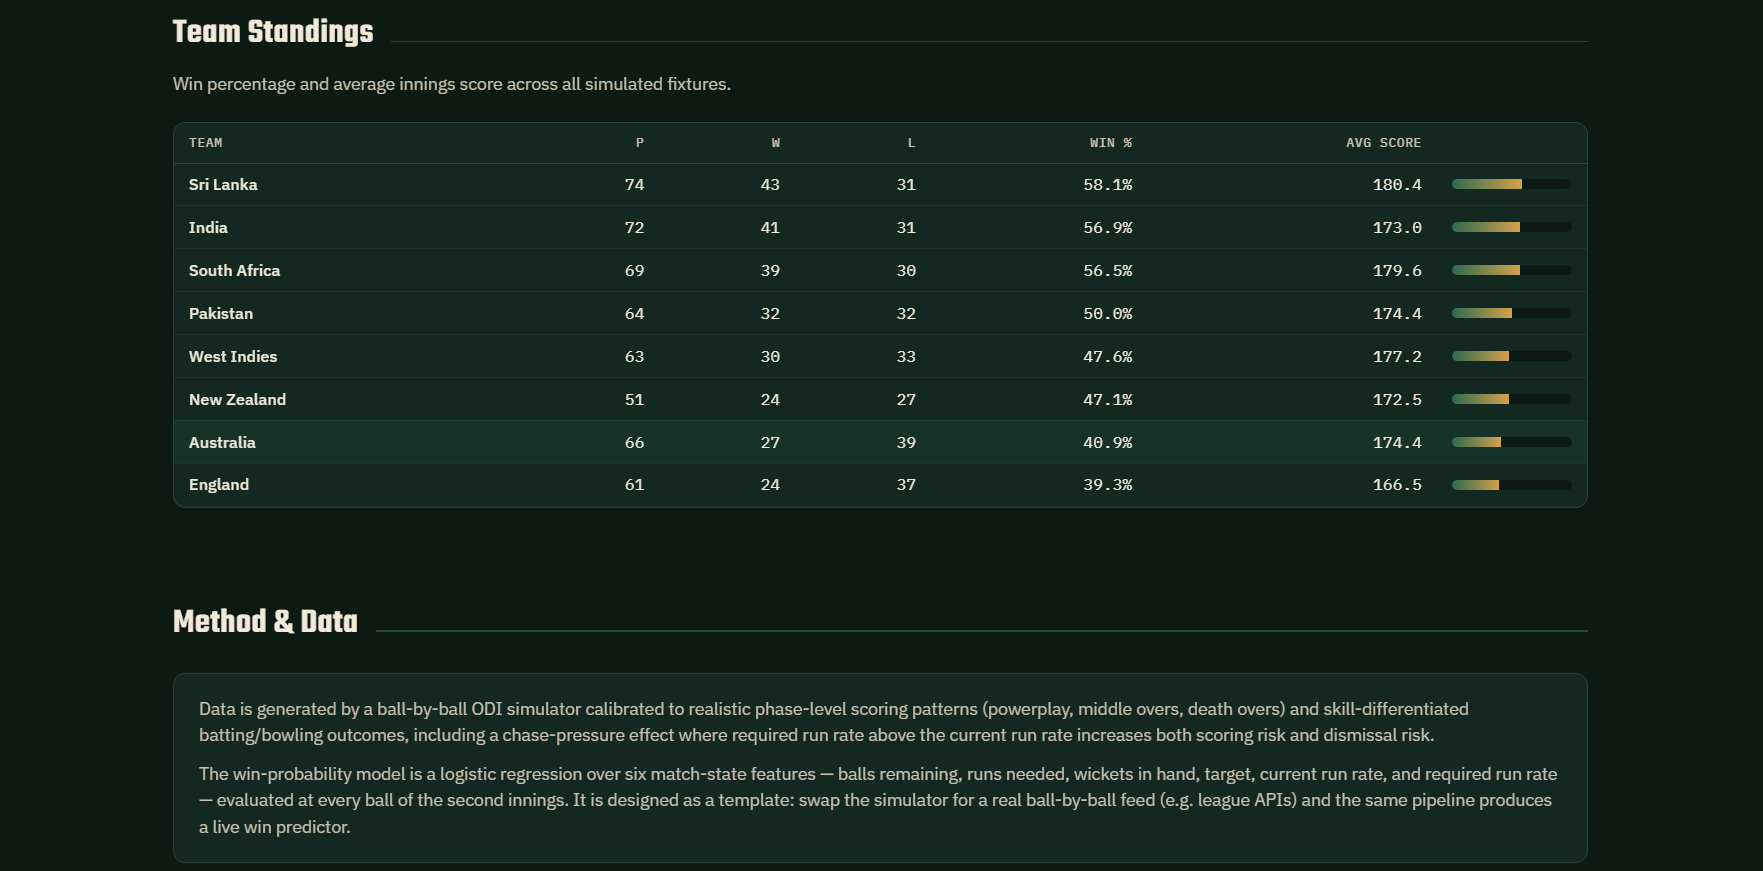
Simulated the data. Real ball-by-ball feeds are usually locked behind commercial APIs, so we built a simulator that generates realistic ODI matches — 260 matches, ~81,000 deliveries — with scoring probabilities that vary by phase (powerplay, middle overs, death overs), by batter/bowler skill, and by chase pressure (a rising required run rate increases both scoring risk and dismissal risk, just like it does in real cricket).
Trained the model. We fit a logistic regression over six match-state features at every ball of the second innings:
$$ P(\text{win}) = \sigma\left(\beta_0 + \sum_{i=1}^{6} \beta_i \cdot \frac{x_i - \mu_i}{\sigma_i}\right), \quad \sigma(z) = \frac{1}{1+e^{-z}} $$
where $x_i$ ranges over balls remaining, runs needed, wickets in hand, target, current run rate, and required run rate. The model reached 0.91 ROC-AUC on held-out deliveries — strong enough that its win-probability curve visibly tracks momentum shifts.
Exported the model to the browser. Rather than standing up a backend, we exported the trained coefficients, feature means, and standard deviations as JSON and re-implemented the same standardize-then-sigmoid logic in vanilla JavaScript. That let the whole dashboard — including the counterfactual replay — run client-side, recomputing win probability in real time with no server round-trip.
Built the Clutch Index. For every player, we split their deliveries into "pressure balls" (required rate meaningfully ahead of current rate) and "normal balls," then compared strike rate / economy and dismissal risk between the two groups. Small samples are shrunk toward zero using $\text{index} \times \frac{n}{n+k}$, so a player with only a handful of pressure balls doesn't produce a wildly inflated (or deflated) score.
Designed it like a scoreboard, not a spreadsheet. The visual language borrows directly from the sport — turf greens, a stitched-ball red, a stadium-display type treatment — so the interface reads as cricket-specific rather than a generic dark-mode dashboard.
Challenges we ran into
- Making the counterfactual replay actually consistent. Rewriting one ball changes the score and wickets for every ball after it. We had to recompute the delta introduced at the edited ball and propagate it forward, then re-run the win-probability model on every subsequent state — not just the edited ball itself — so the whole curve stays internally consistent.
- Noisy small samples in the Clutch Index. Early versions had wild swings (some players showed a ±100 point clutch index) because a handful of "pressure balls" isn't a reliable sample. Lowering the pressure threshold to capture more deliveries and applying shrinkage toward zero for thin samples made the leaderboard far more trustworthy.
- Keeping a machine-learning model portable without a backend. Embedding a trained model's logic directly in JavaScript meant we had to be precise about matching the exact standardization and coefficients used in training — any mismatch would silently produce wrong probabilities.
What we learned
- How much of a "real-time" ML feature is really just careful state management — the model math is simple; the hard part was making the sequence of states (before and after an edit) stay coherent.
- Why shrinkage estimators matter the moment you split data into small subgroups — raw comparisons on thin samples are almost always misleading.
- That a distinctive visual identity (grounded in the sport's own materials — the crease, the seam, the scoreboard) makes an analytics tool feel purpose-built instead of templated.
What's next
Swapping the simulator for a real ball-by-ball feed (e.g. a licensed cricket API) would let the same pipeline power a genuinely live win predictor, and we'd like to extend the Clutch Index to compare players head-to-head in must-win situations specifically, not just pressure deliveries in general.
Built With
- chart-js
- cricket
- css3
- data-visualization
- git
- github
- google-fonts
- html5
- javascript
- logistic-regression
- machine-learning
- numpy
- pandas
- predictive-modeling
- python
- scikit-learn
- sports-analytics
- vs-code

Log in or sign up for Devpost to join the conversation.