-
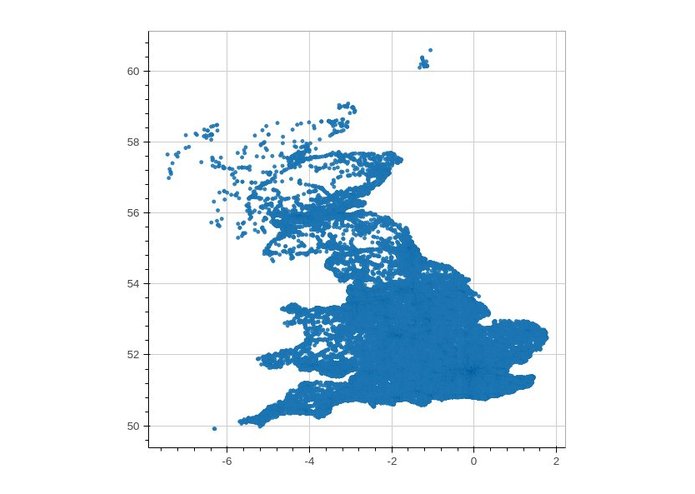
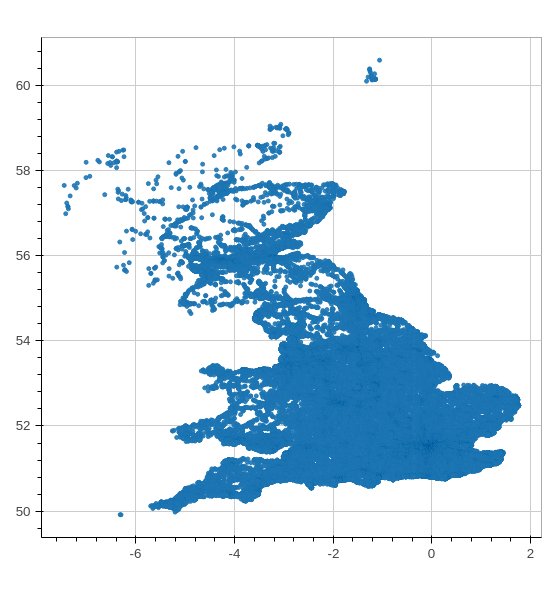
Scatter plot of all the accidents
-
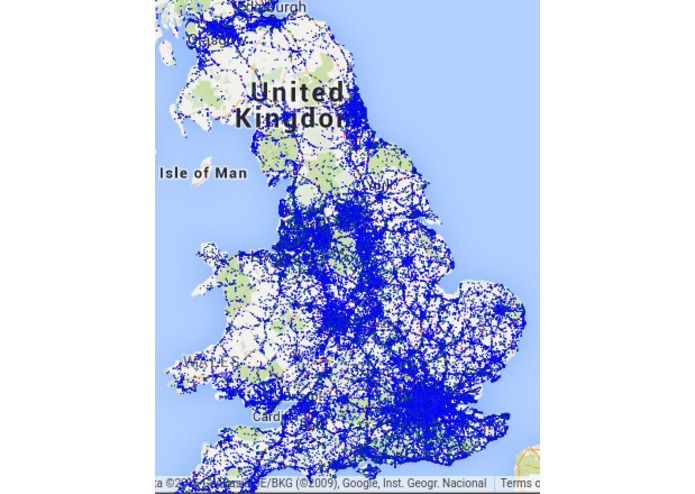
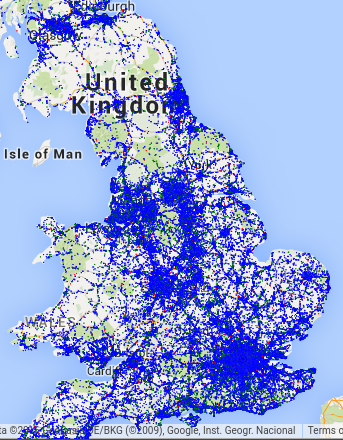
Heatmap overlay over google maps
Inspiration
HALF A GIG OF DATA? What couldn't tickle your curiosity more? When we initially saw this data set provided by the government, we dived straight into it, excited by the results we could produce.
What it does
Provides two visualisations for the user: 1: Overlays a google map with a heatmap representing accident severity across the UK 2: Plots a scatter plot of latitude against longitude for every accident
How we built it
Python and the Bokeh visualisation library
Challenges we ran into
We initially started working on this with SQLite and d3.js however we ran into problems having 1.6 million javascript objects in the browser. Thus, halfway through, we switched to a much simpler implementation in python.
Accomplishments that we're proud of
Getting working visualisations after hours of grafting and experimentation.
What we learned
Parts of the d3.js library as well as the Bokeh library and python
What's next for CrashMap
Widgets to filter data on the map

Log in or sign up for Devpost to join the conversation.