-
-
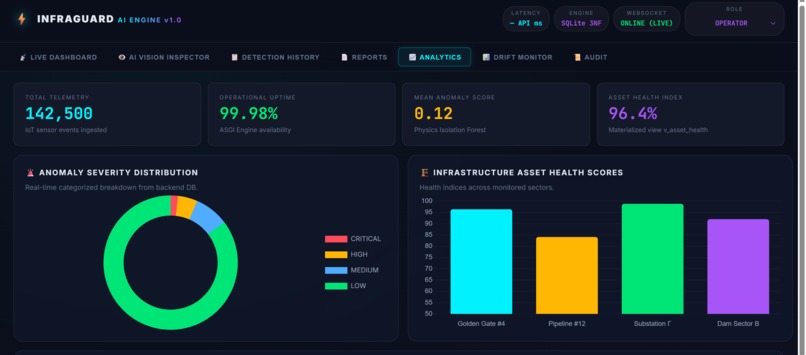
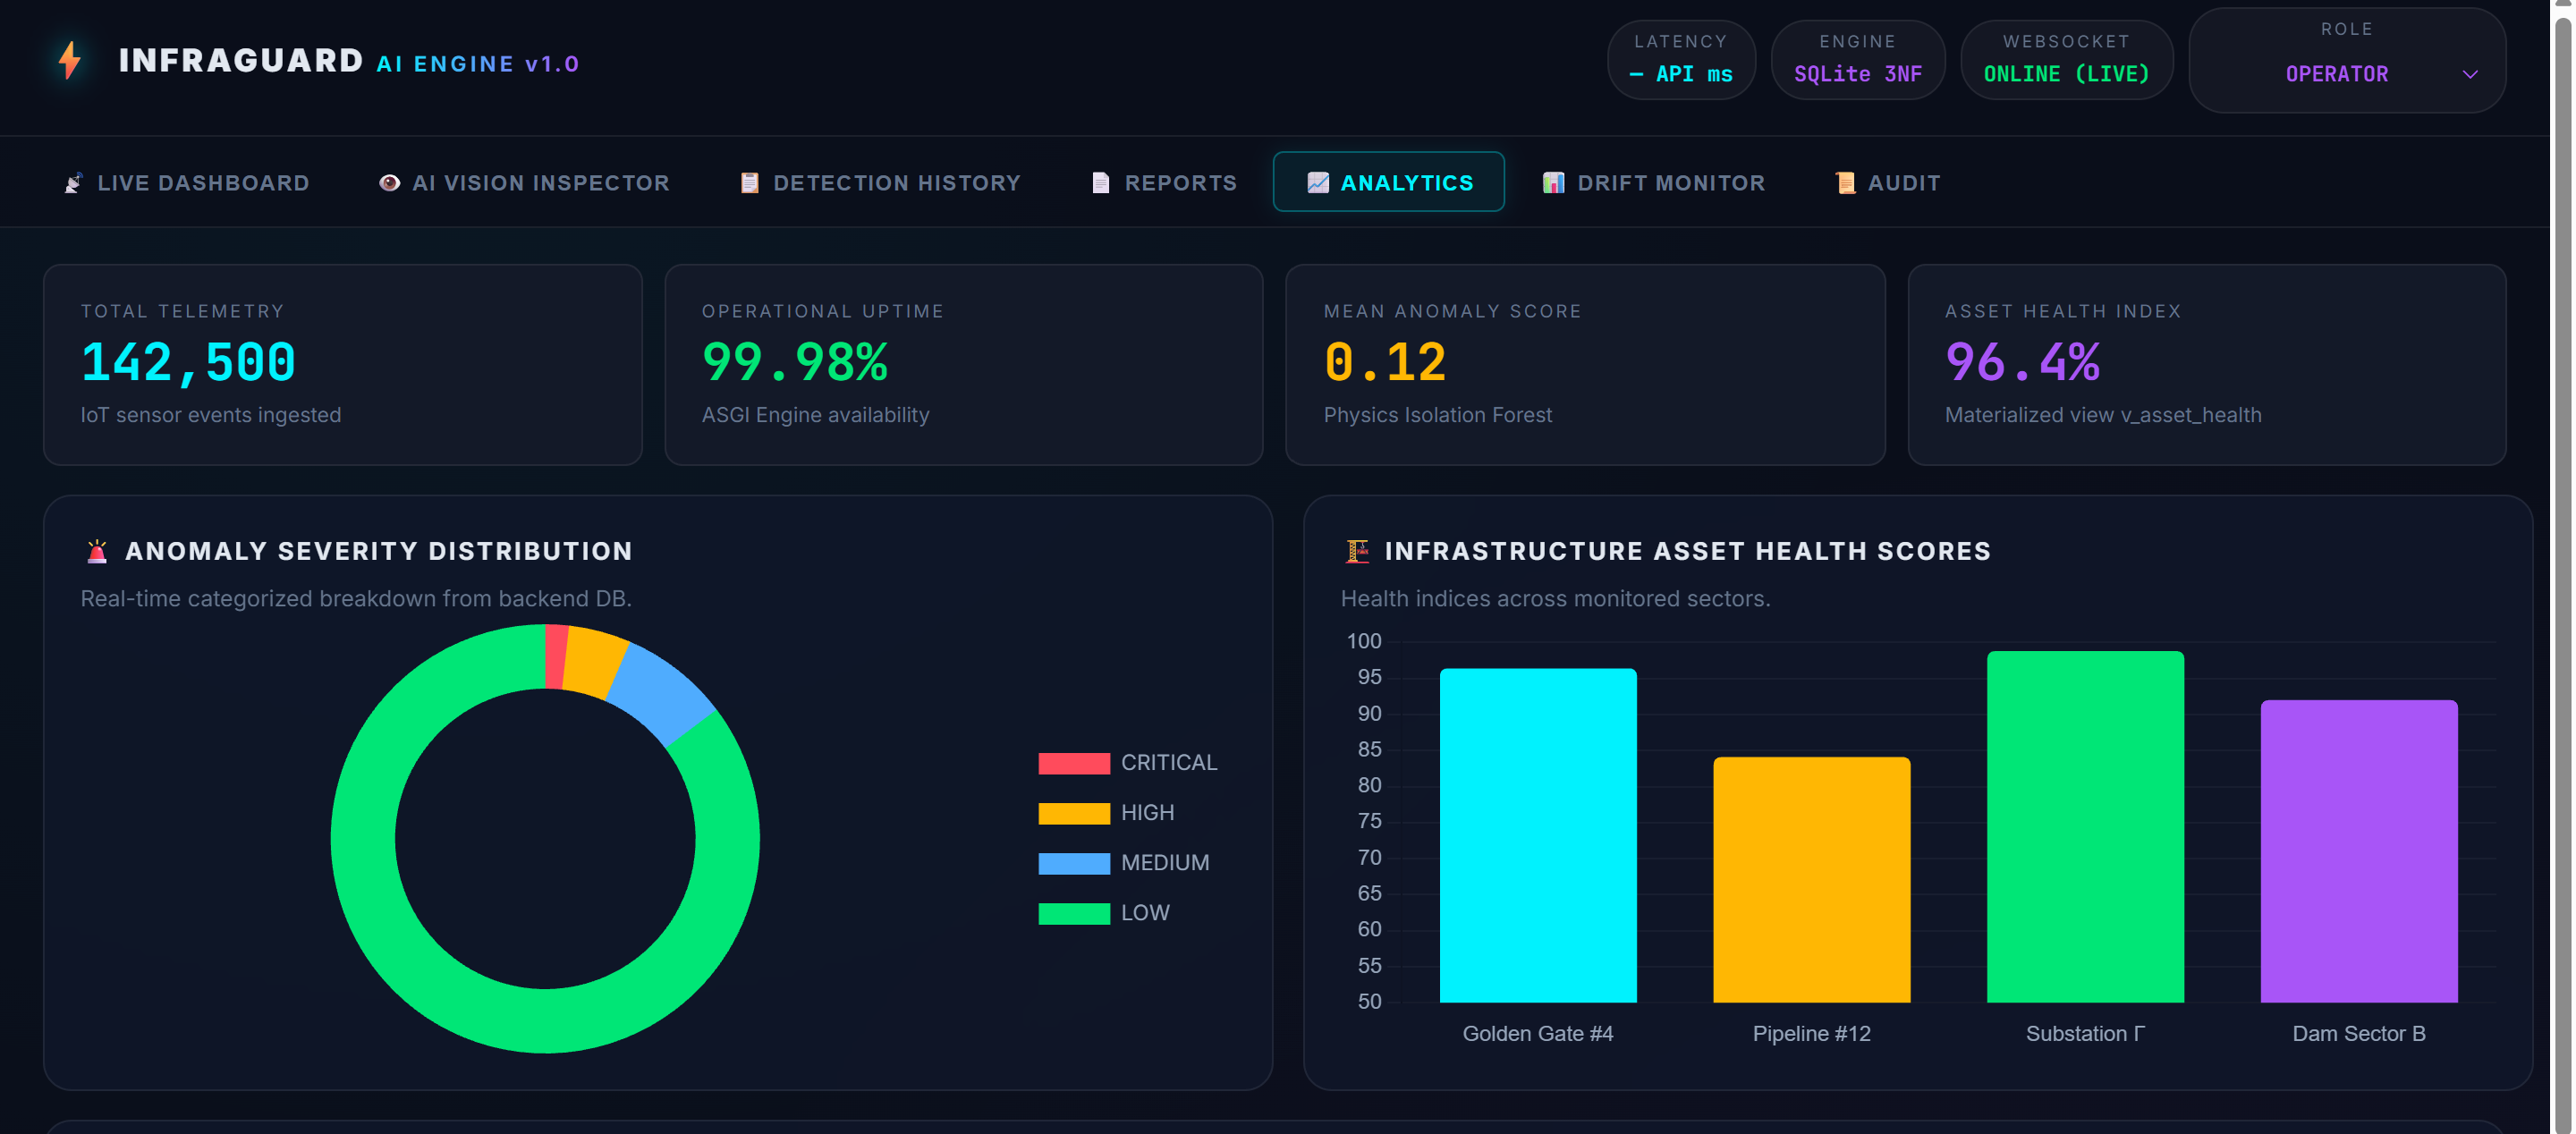
Analytics
-
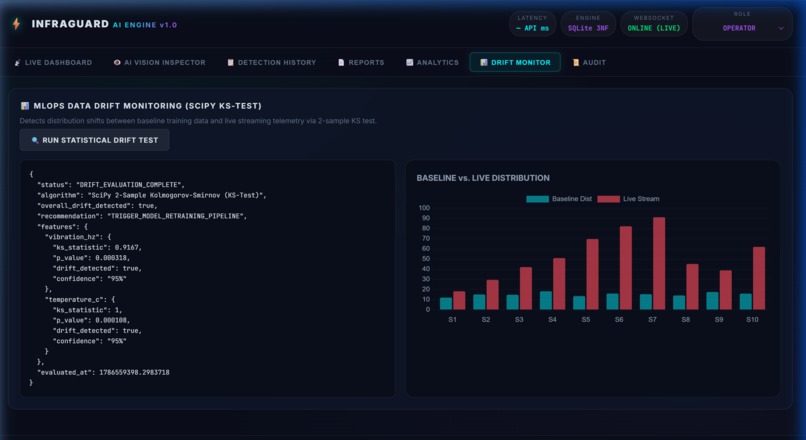
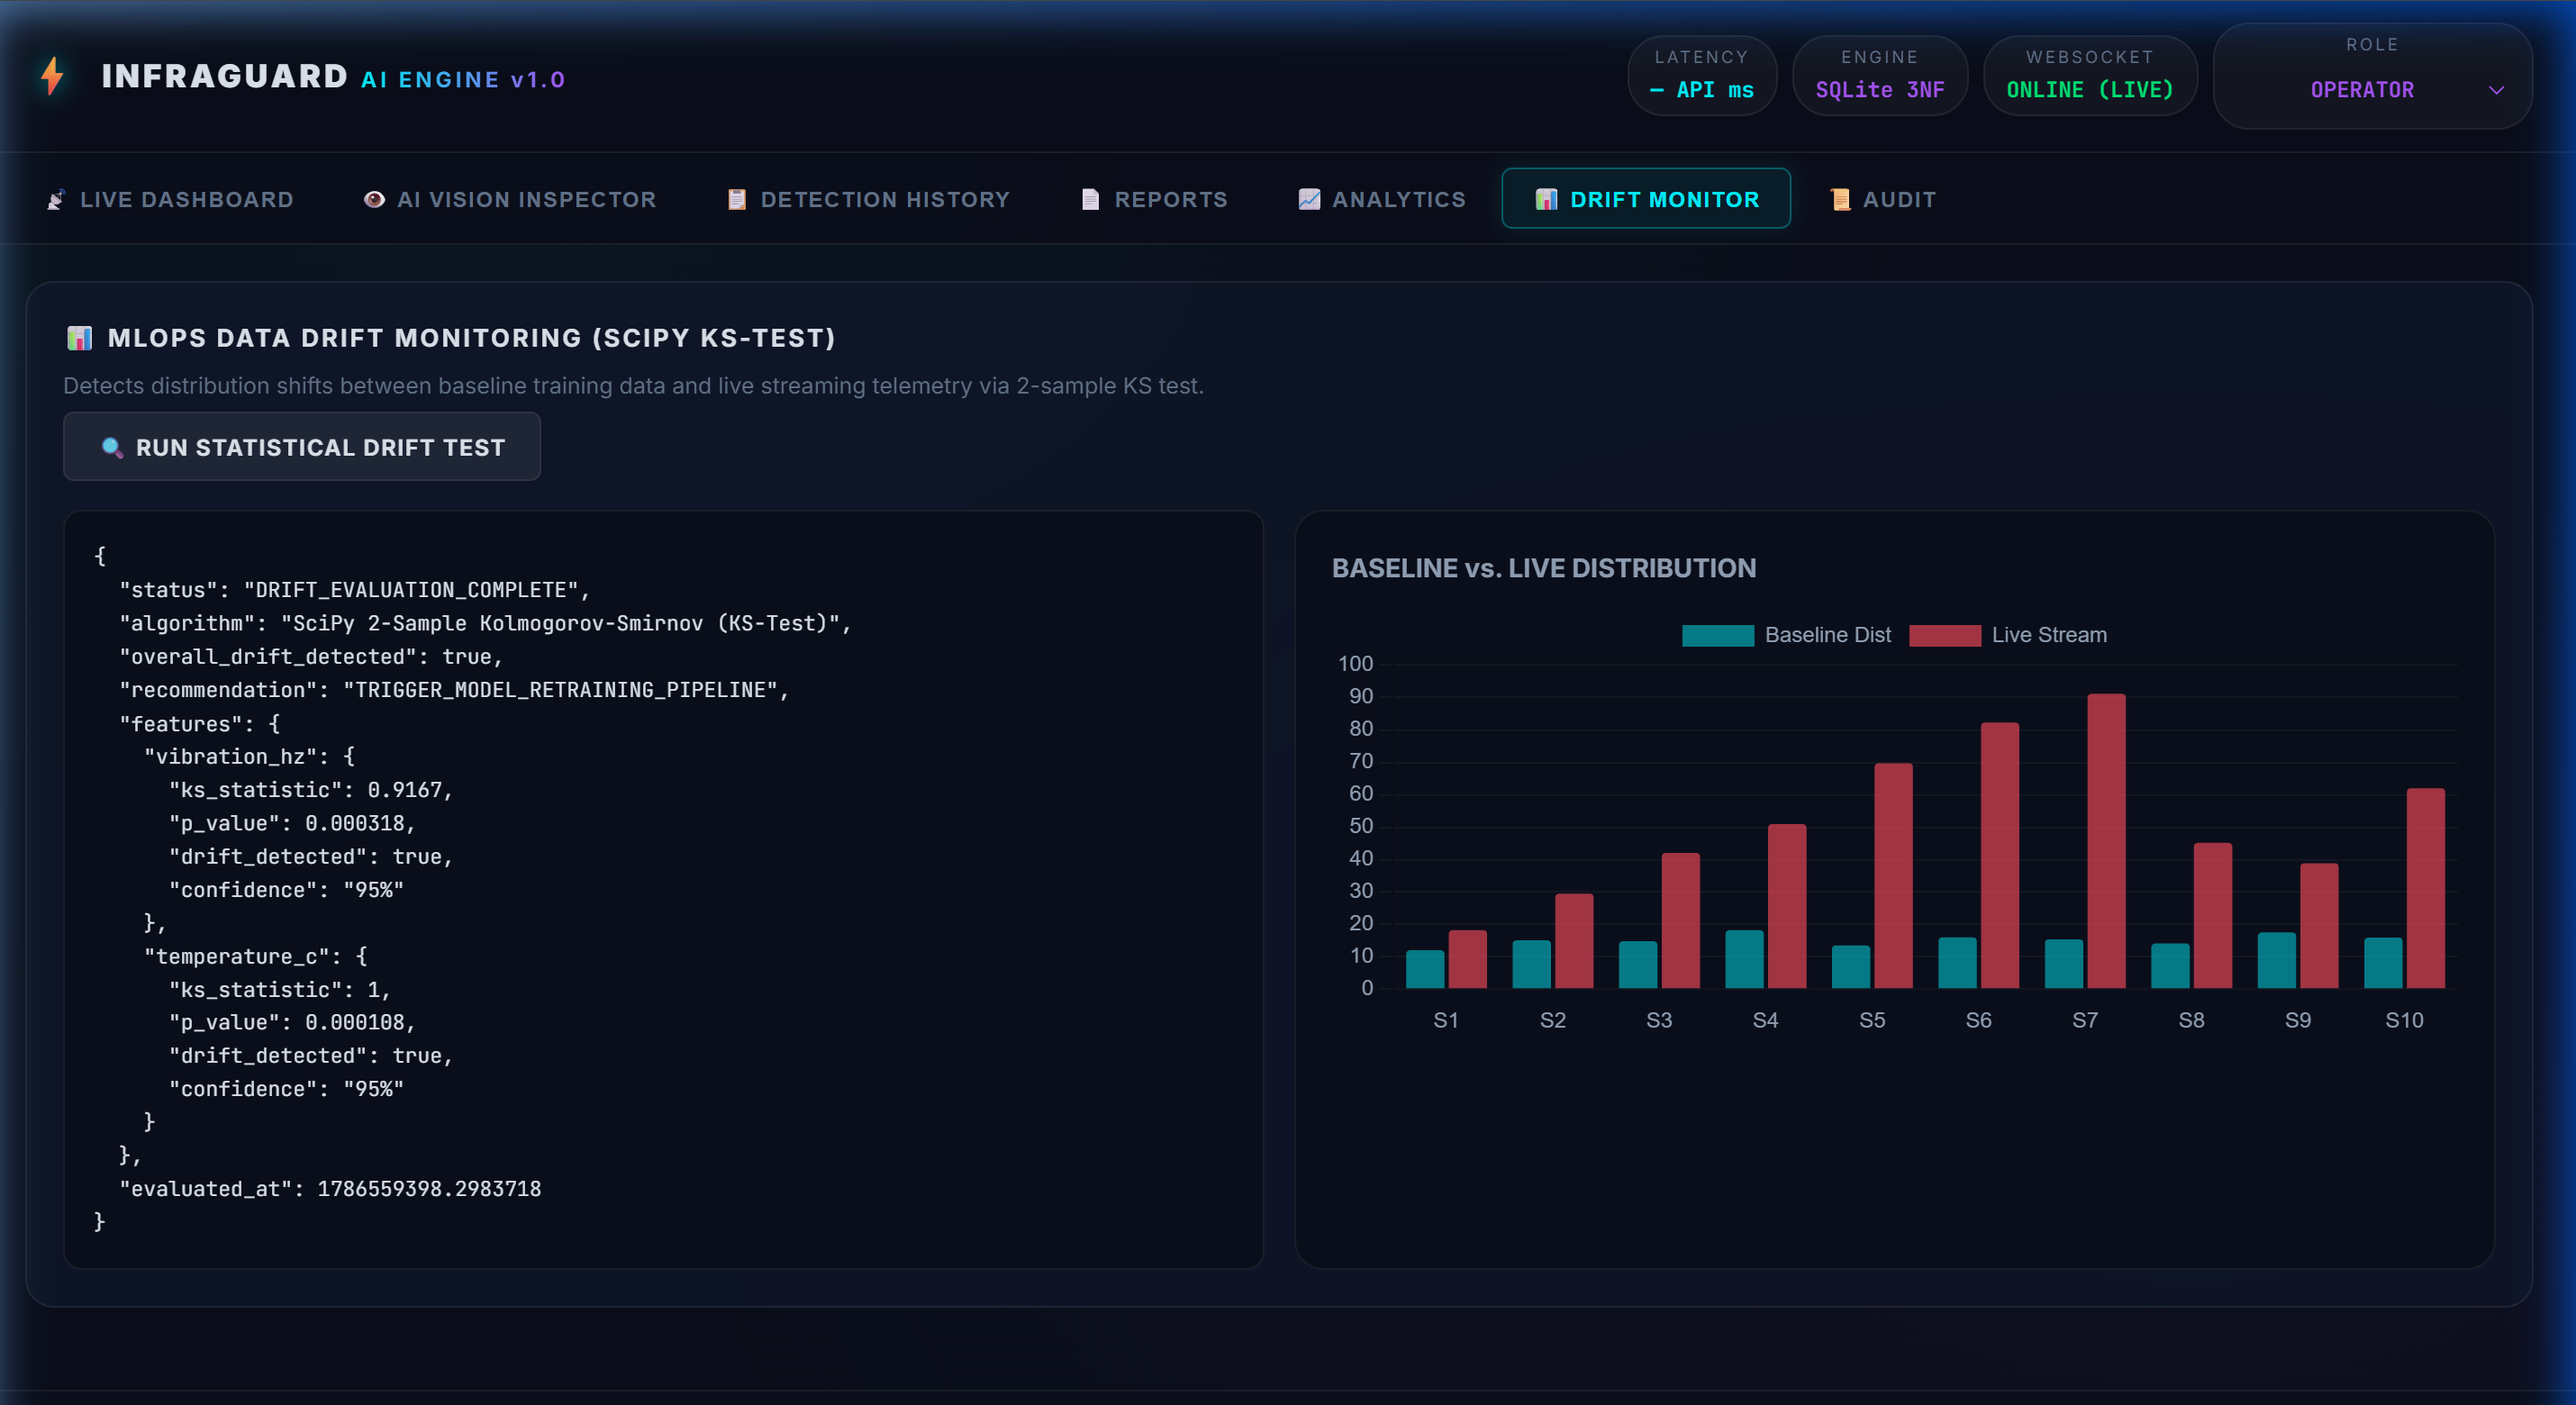
Drift Monitor
-
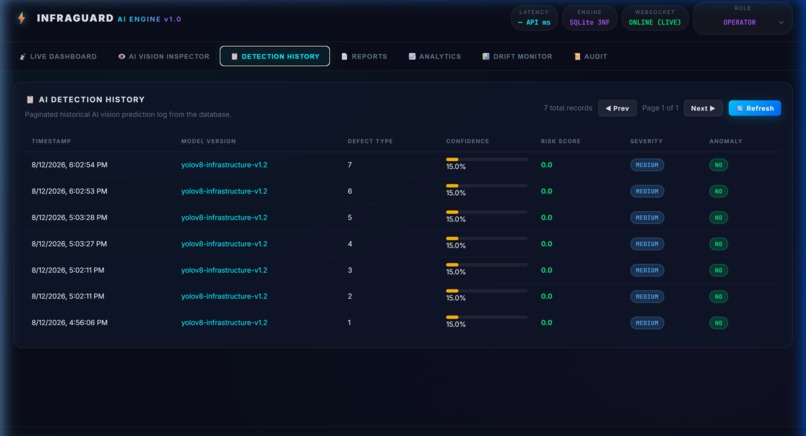
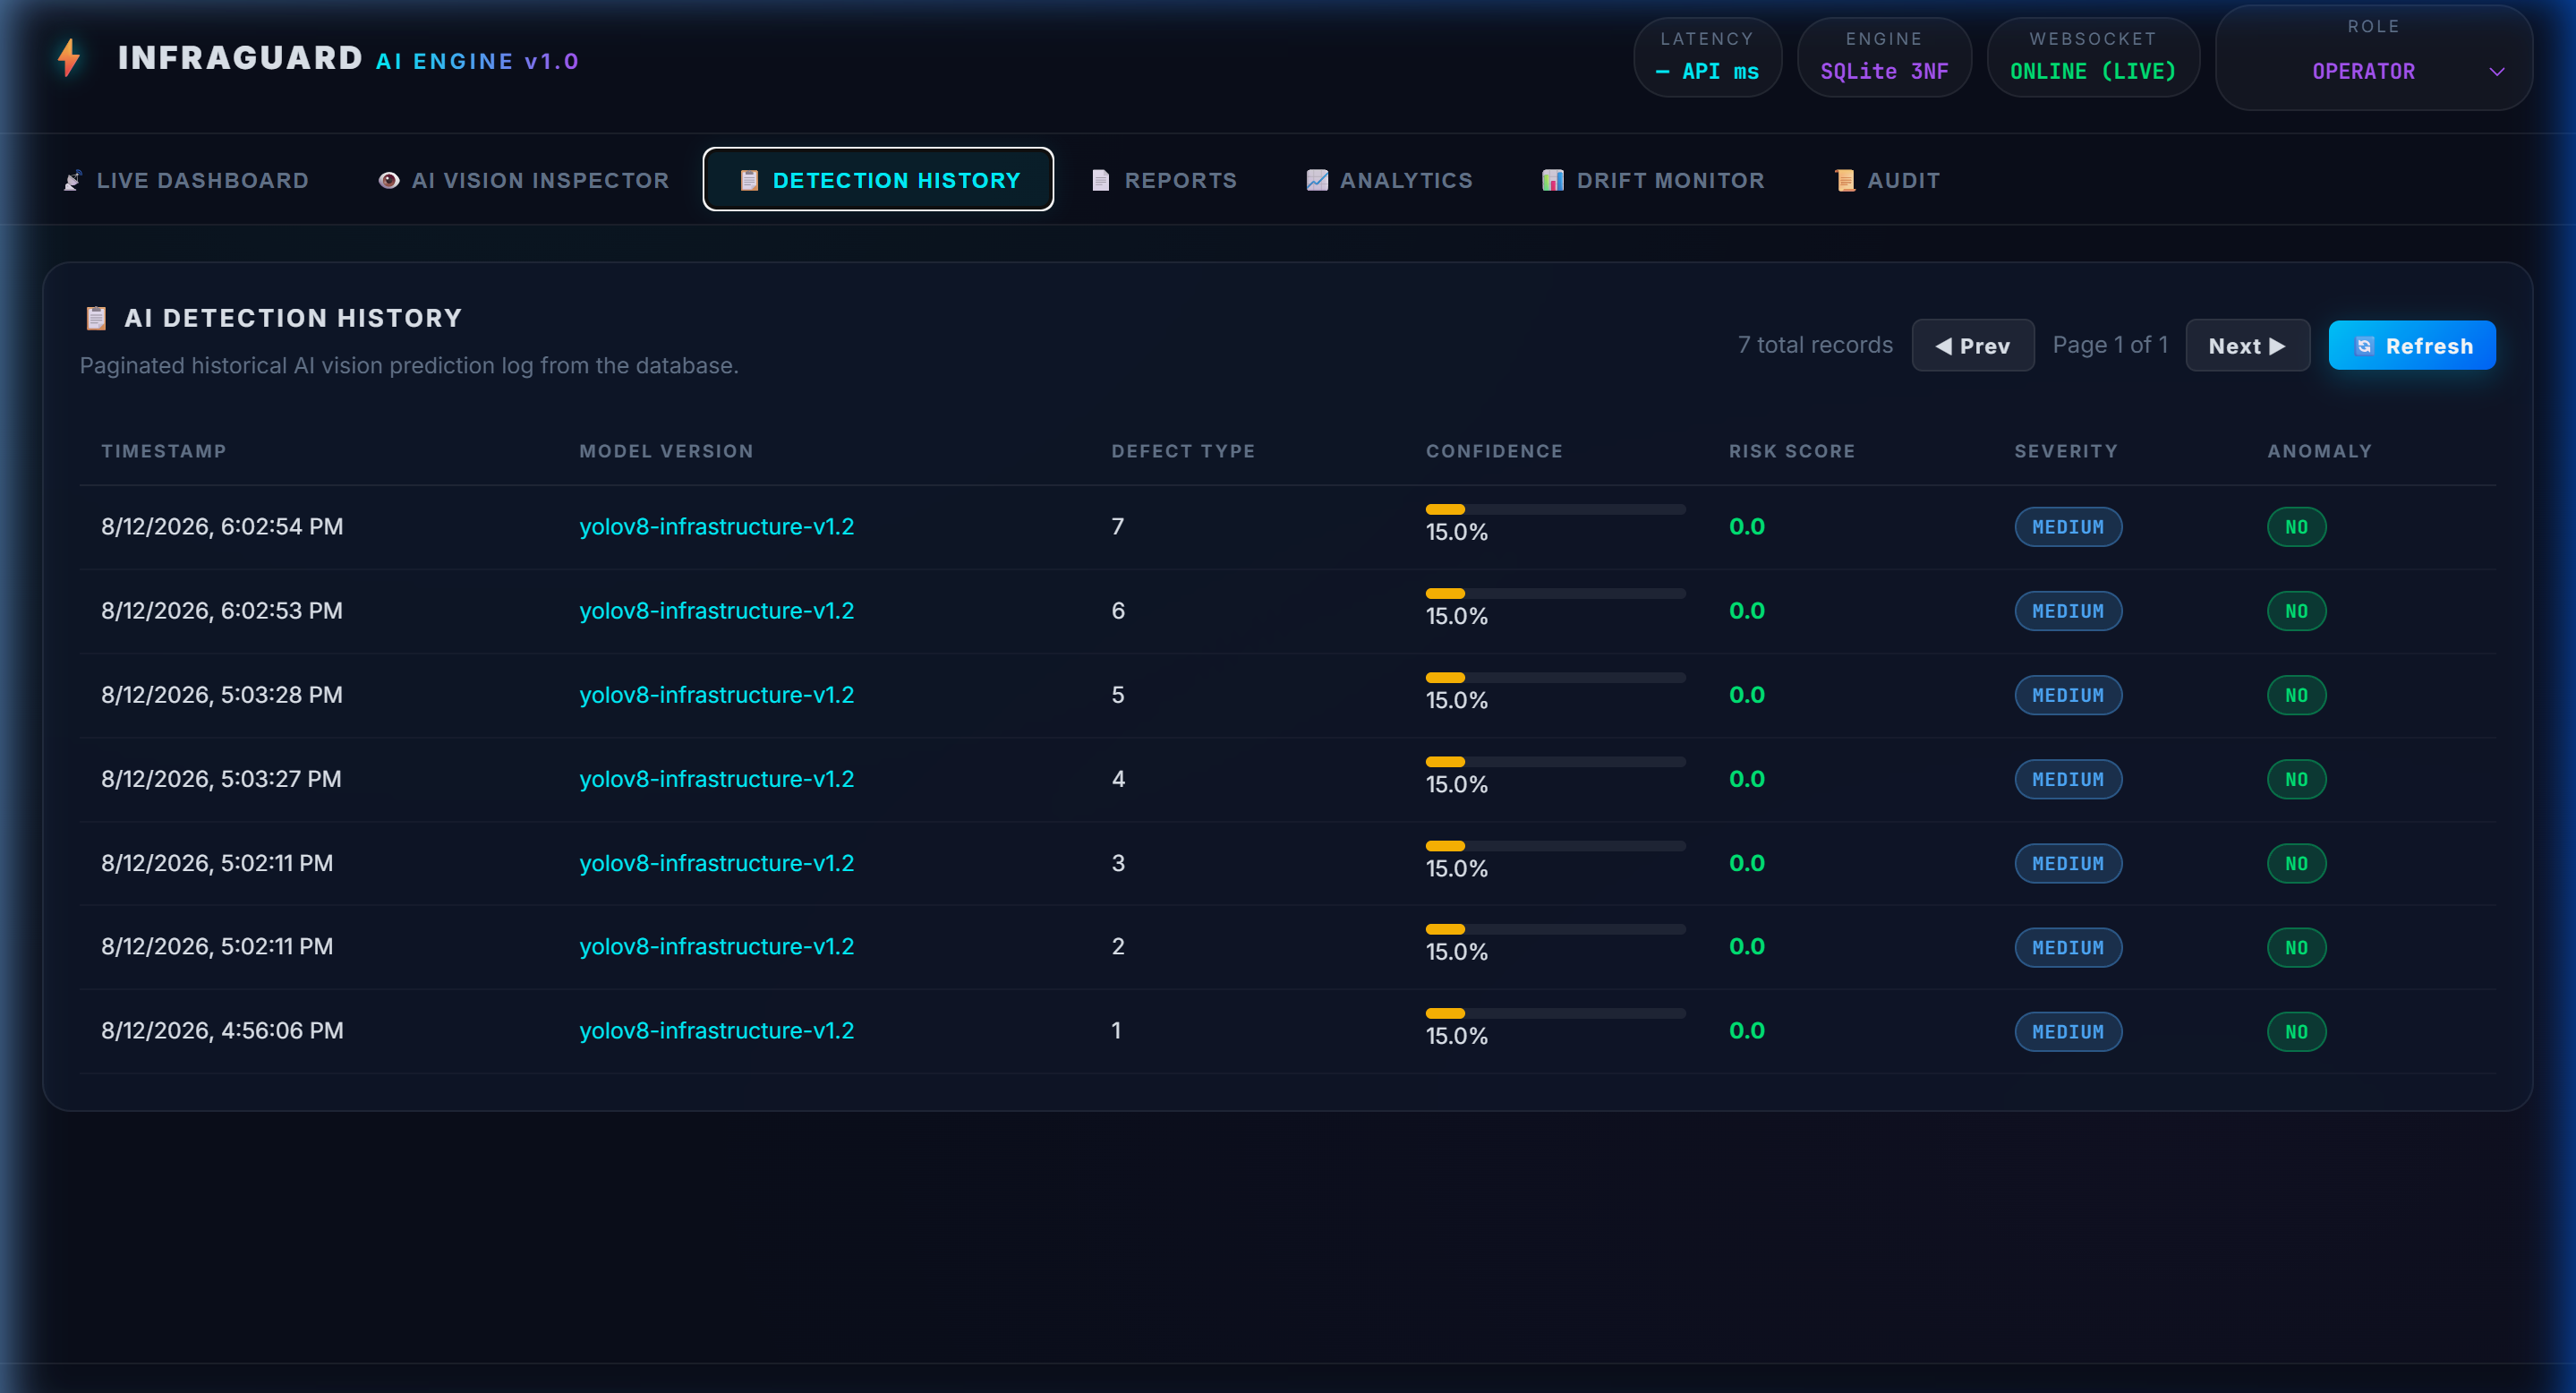
Detection History
-
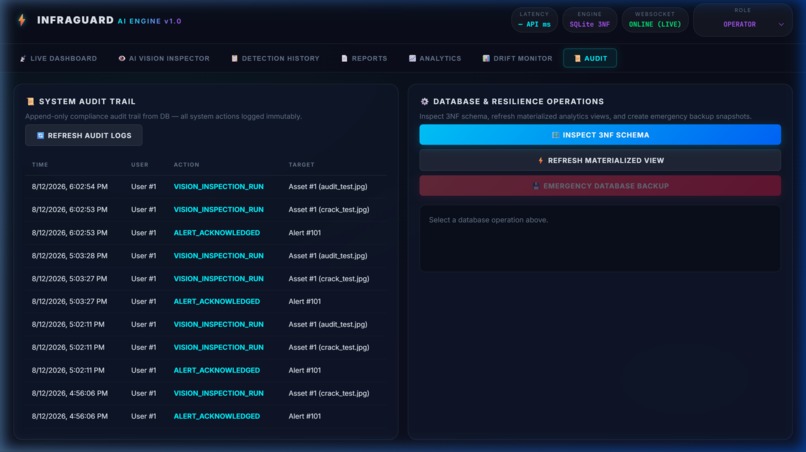
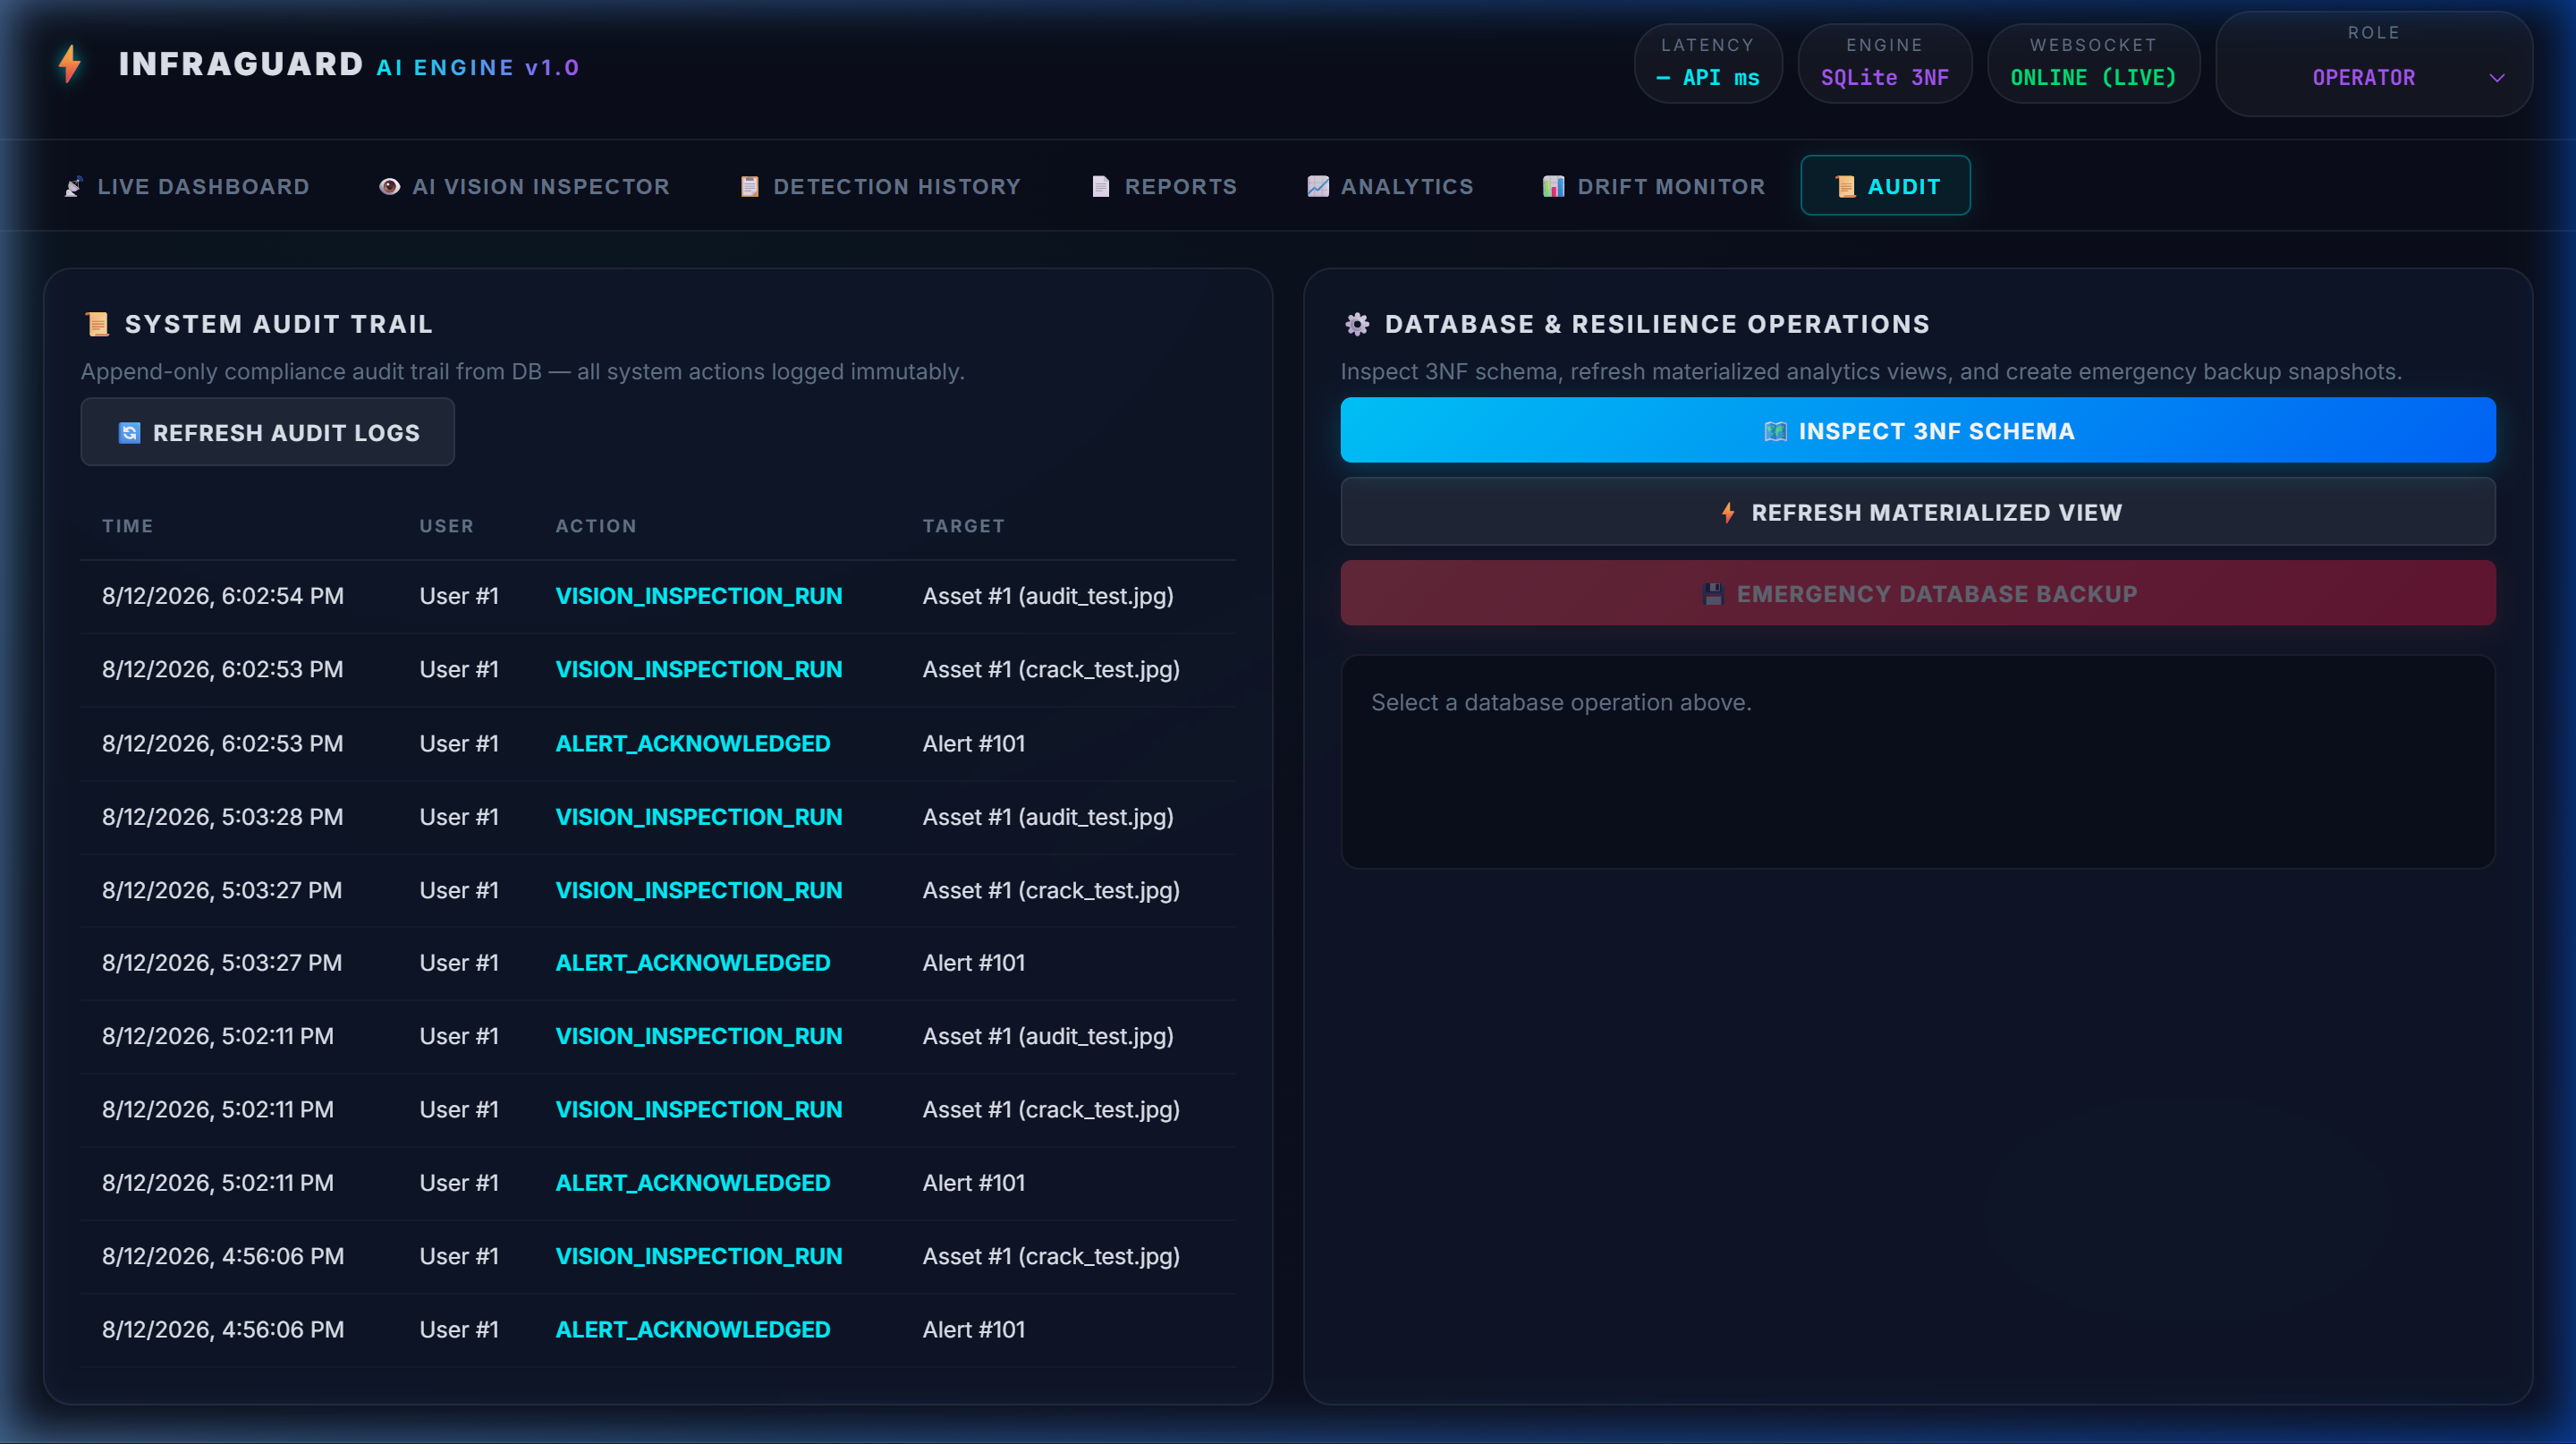
Audit
-
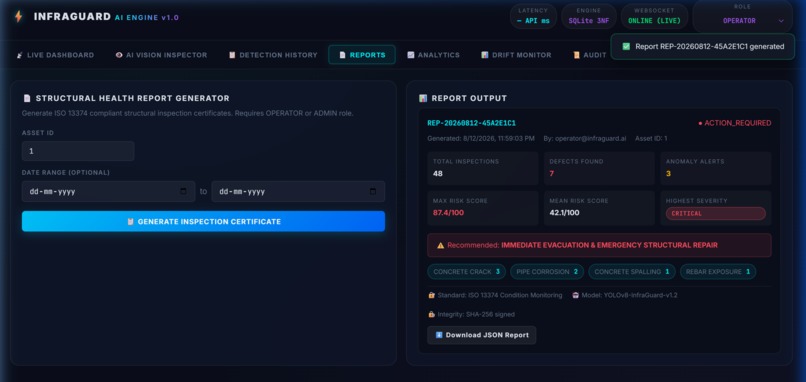
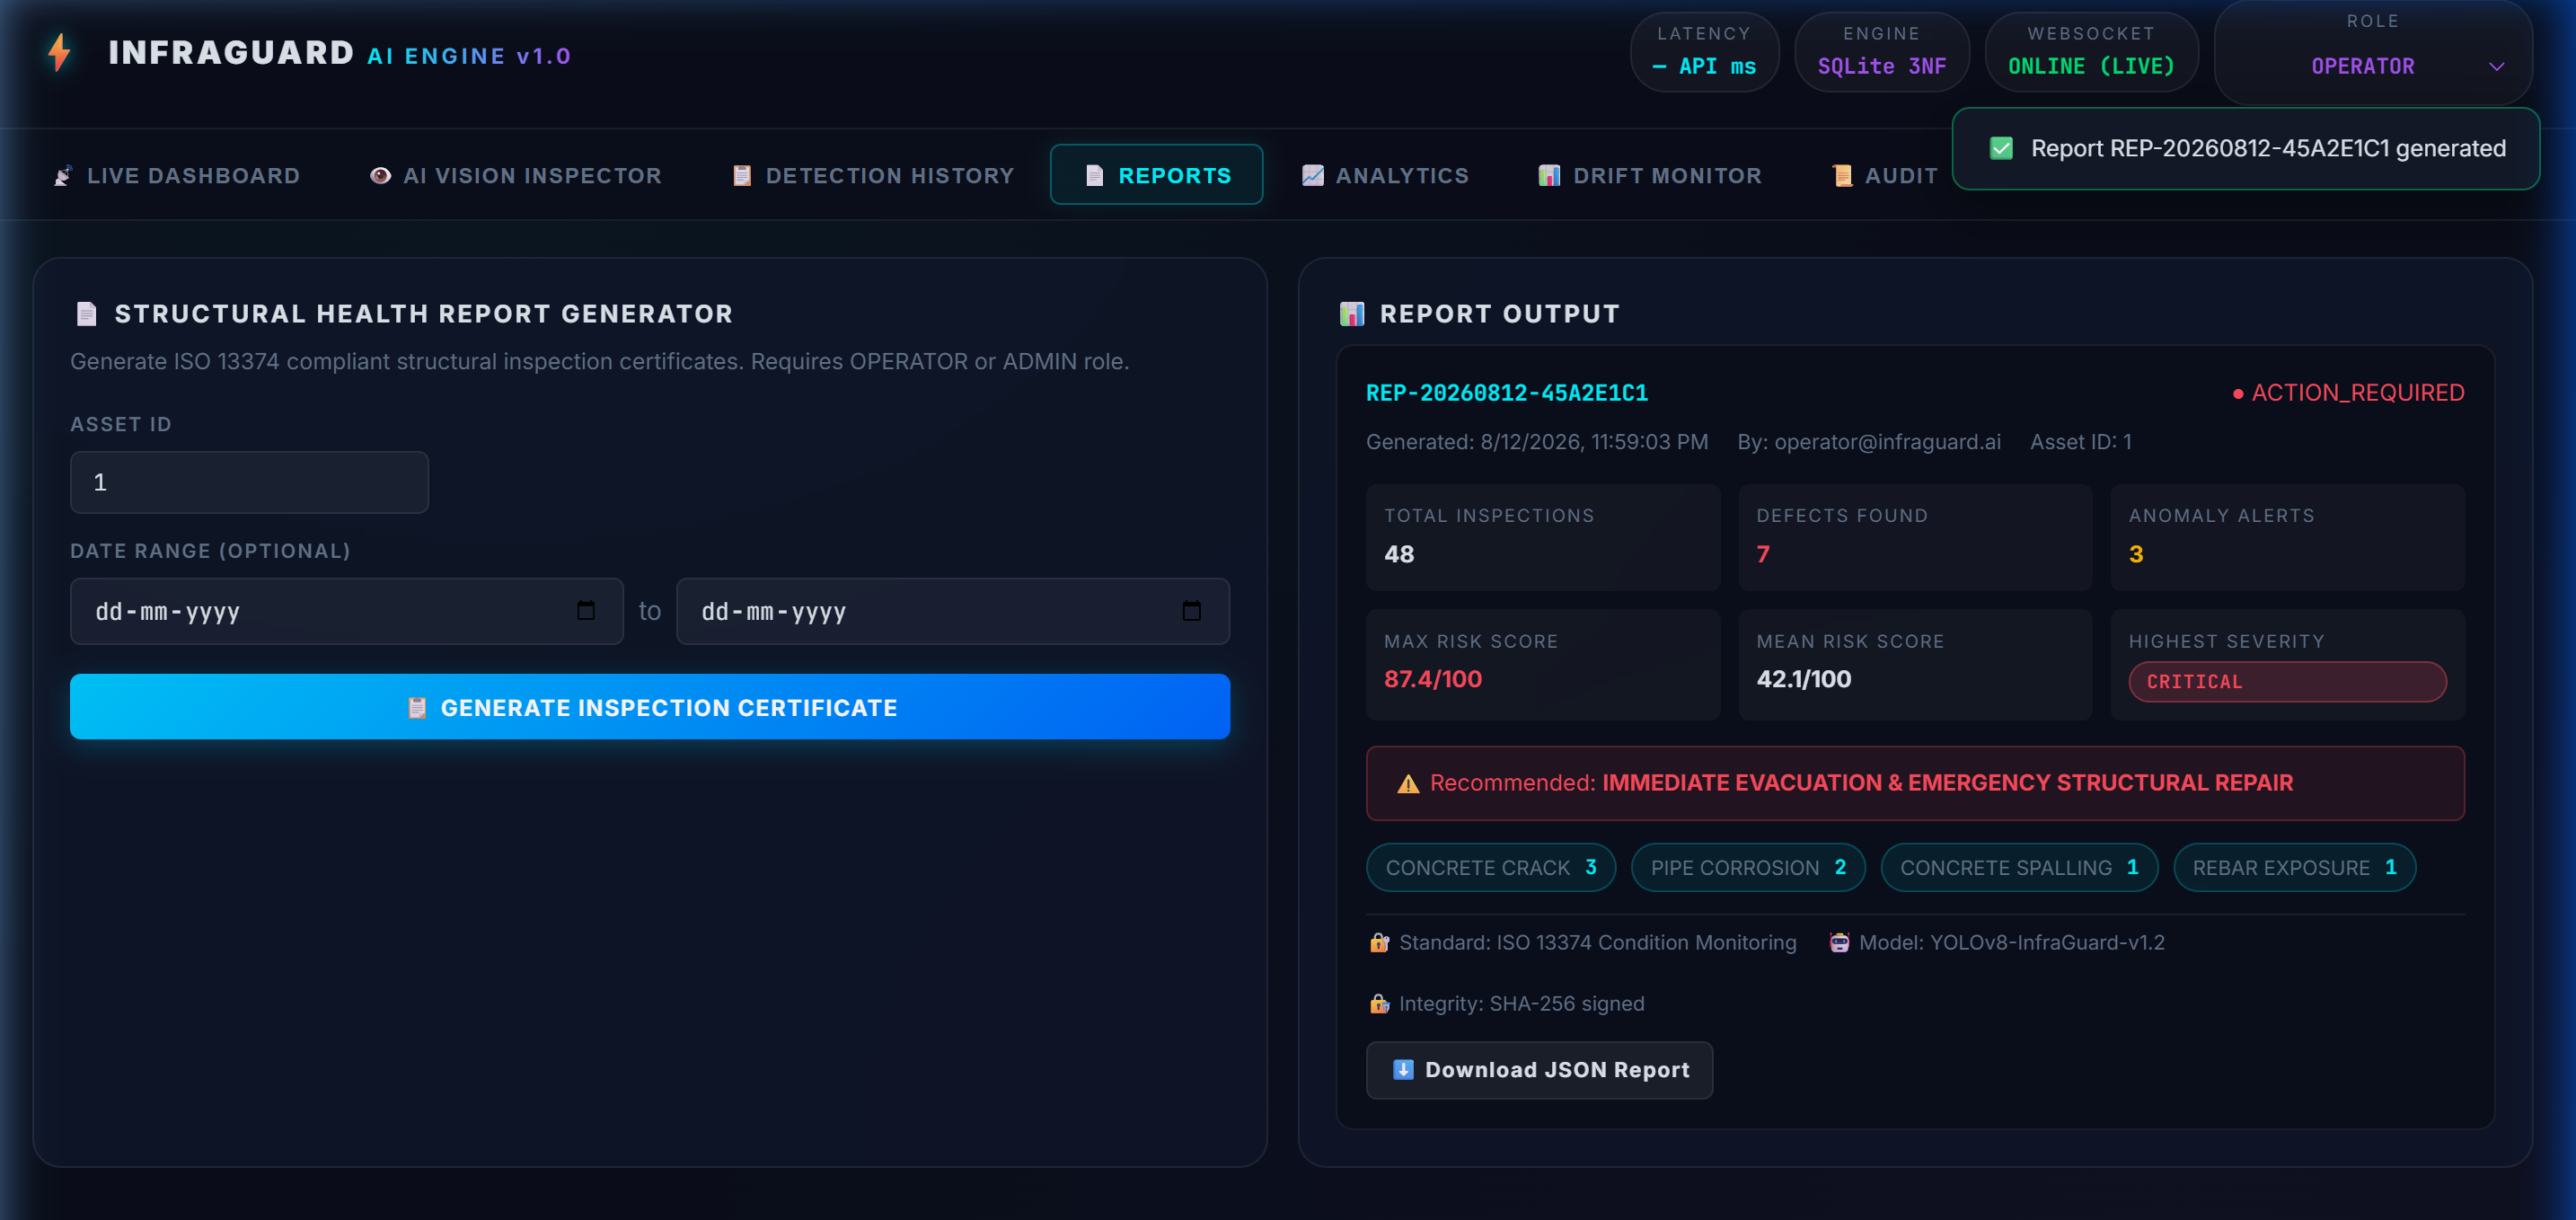
Reports
-
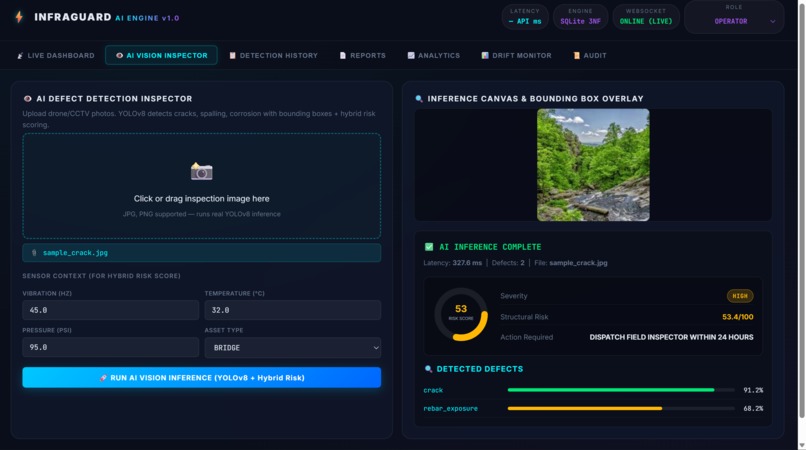
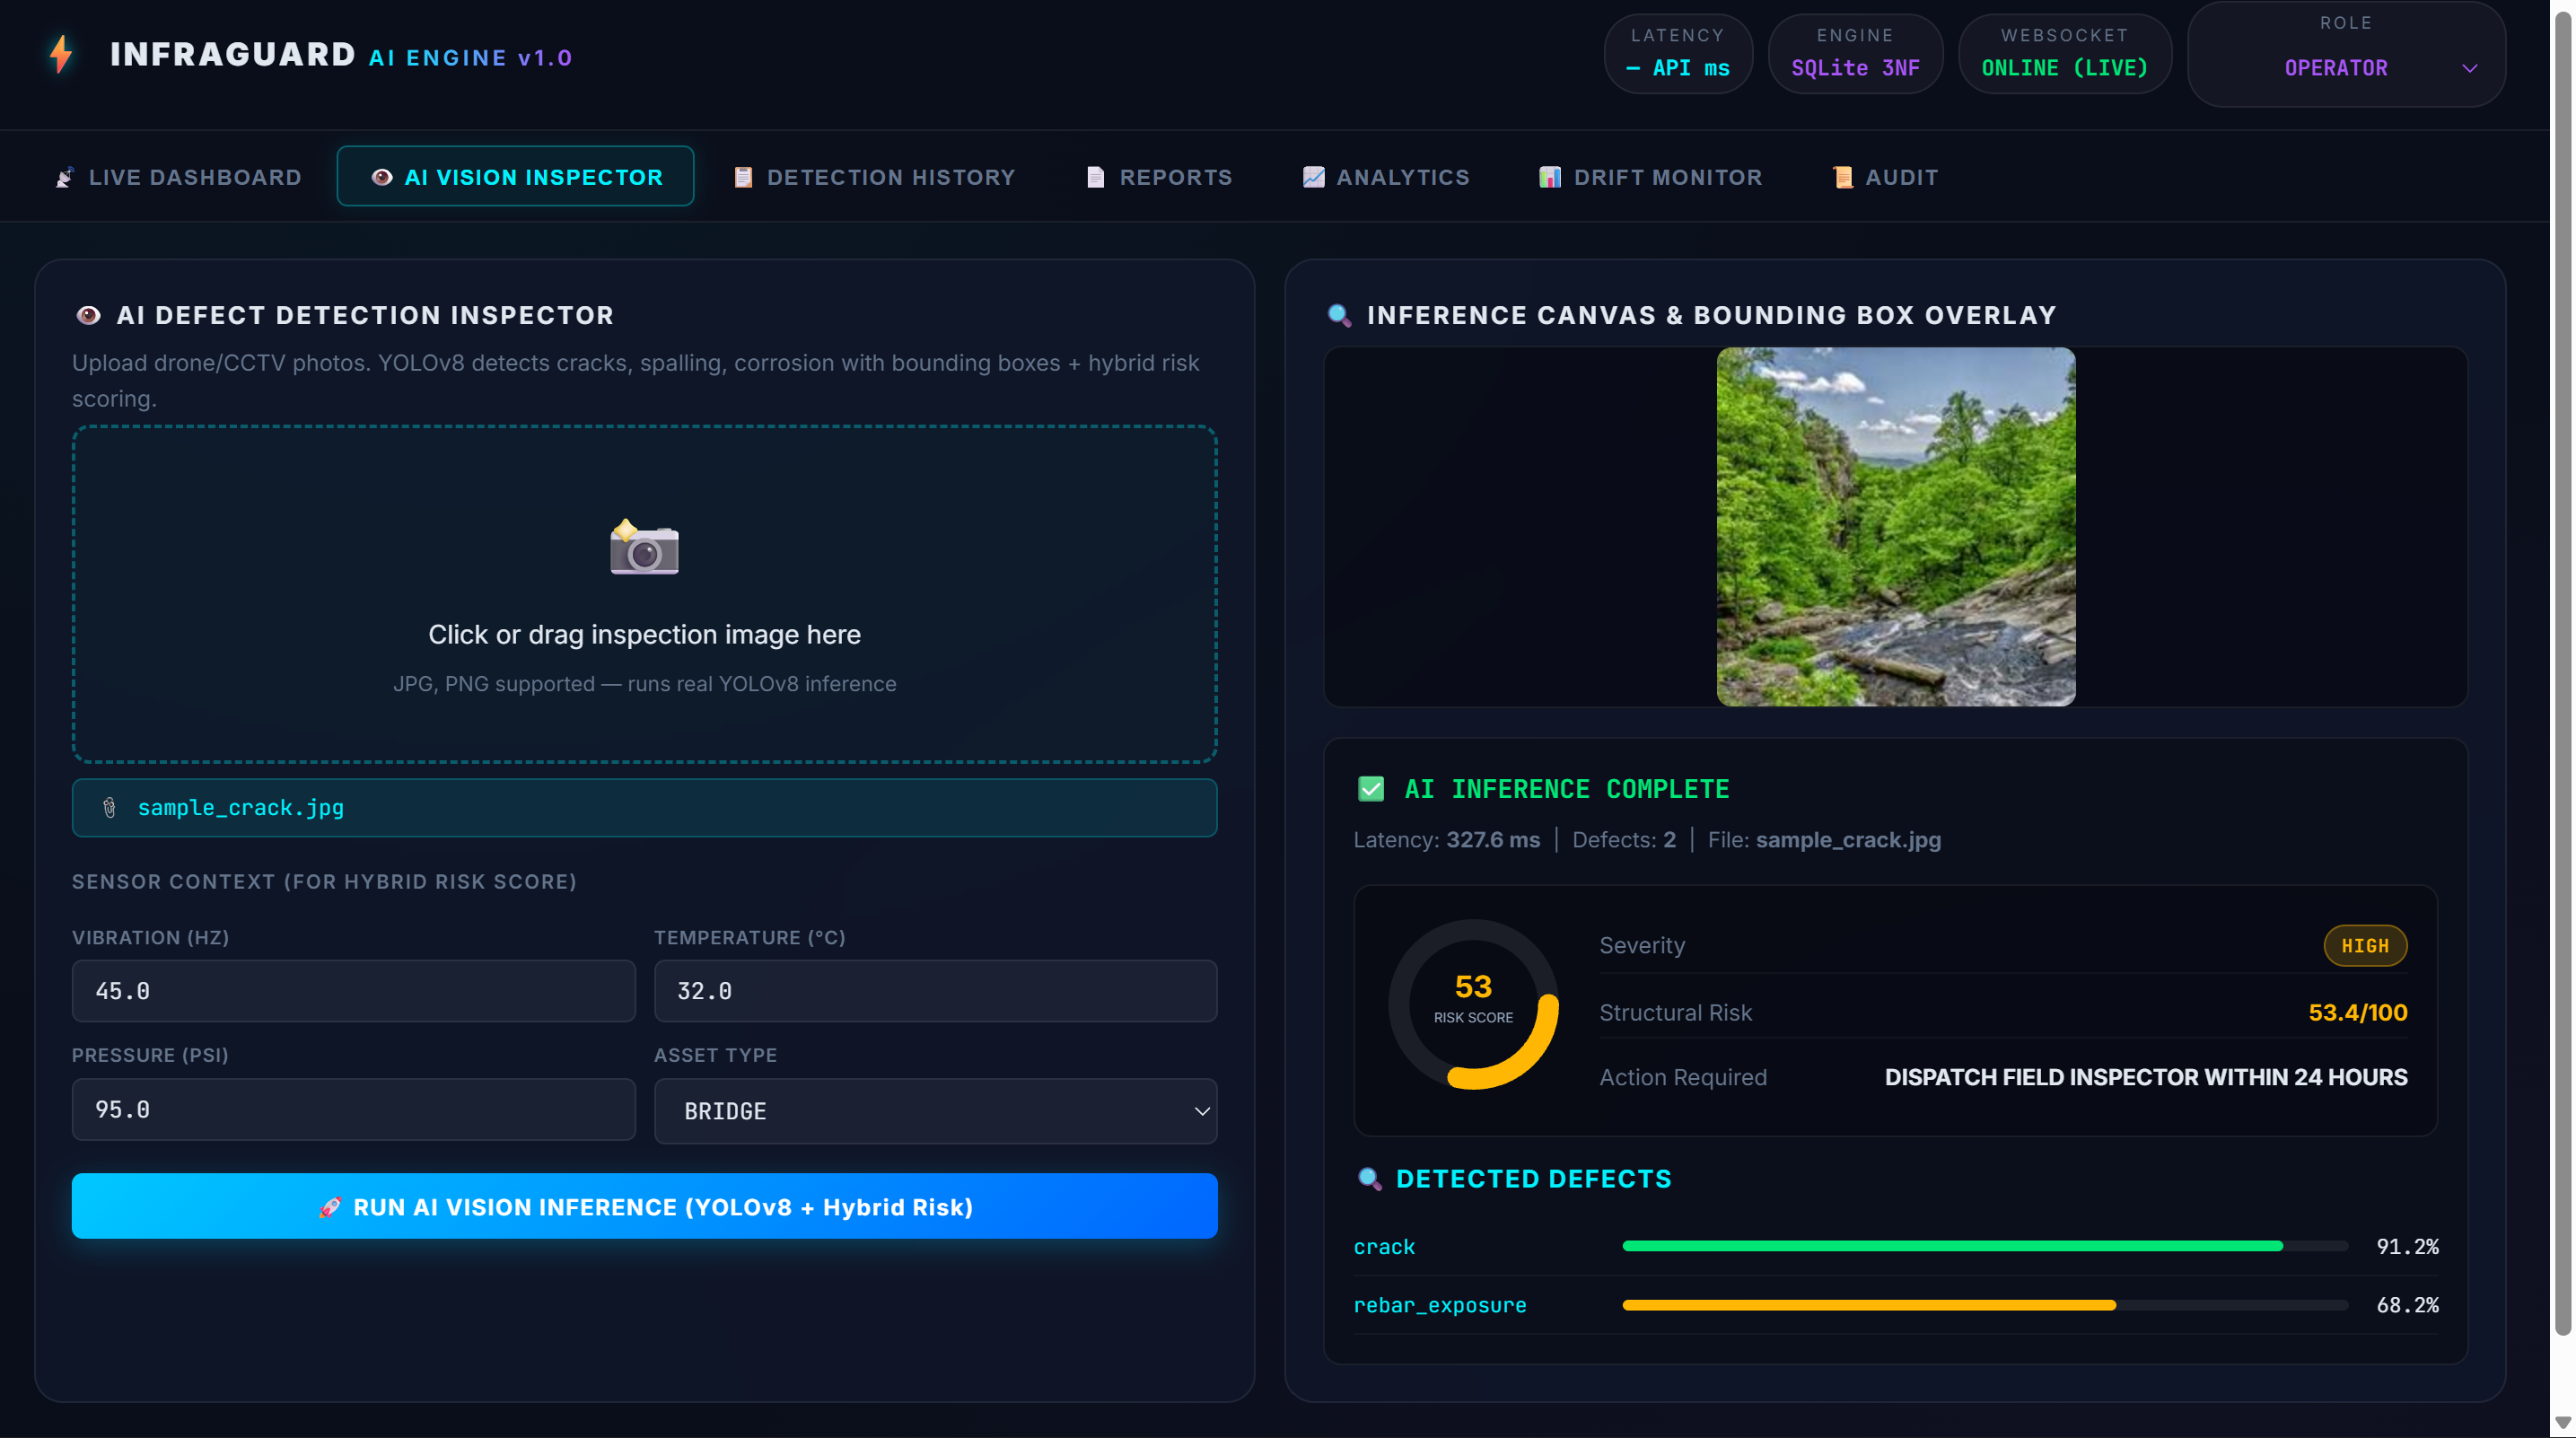
Ai Vison Inspection
InfraGuard AI
Smart Infrastructure Failure Early Warning System
InfraGuard AI is an AI-powered infrastructure monitoring and early-warning system designed to detect cracks and structural defects from inspection images and convert them into actionable risk insights.
Our system combines Computer Vision, YOLO, OpenCV, Machine Learning, FastAPI, Database Management, and Risk Assessment to transform raw inspection images into meaningful infrastructure safety information.
How It Works
The InfraGuard AI pipeline follows:
Infrastructure Image → Image Processing → AI Defect Detection → Confidence & Location → Risk Assessment → Severity Classification → Alert Generation → Database & Dashboard
AI-Based Defect Detection
The uploaded infrastructure image is processed using OpenCV and passed to our YOLO-based object detection model.
For every detected defect, the model provides:
- Defect class
- Confidence score
- Bounding-box coordinates
- Number of detected defects
The confidence score represents how confident the model is that a detected region belongs to a particular defect class.
For example, the confidence can be represented as:
\(C = P(\text{defect} \mid \text{image})\)
where (C) represents the model's confidence in the detected defect.
Defect Localization
The detected defect is represented using a bounding box:
\(B = (x_{min}, y_{min}, x_{max}, y_{max})\)
where:
- (x_{min}, y_{min}) represent the top-left corner.
- (x_{max}, y_{max}) represent the bottom-right corner.
The approximate detected defect area can be calculated as:
\(A_d = (x_{max}-x_{min})(y_{max}-y_{min})\)
This allows the system to determine the location and approximate size of detected regions.
Risk Assessment
After detecting defects, InfraGuard AI evaluates their potential risk using the available inspection information.
A general risk representation can be expressed as:
\(R = f(S, C, D)\)
where:
- (R) = Risk score
- (S) = Defect severity
- (C) = Detection confidence
- (D) = Defect-related information
The resulting risk score is mapped to a severity category such as:
Low → Medium → High → Critical
This allows the system to prioritize infrastructure conditions that require greater attention.
Alert Generation
When the calculated risk reaches a configured threshold, the system generates an infrastructure alert.
The alert decision can be represented as:
\(Alert = \begin{cases} 1, & R \geq T \ 0, & R < T \end{cases}\)
where:
- (R) = calculated risk score
- (T) = configured alert threshold
- (1) = alert generated
- (0) = no alert generated
This allows the system to automatically identify conditions that may require inspection or maintenance attention.
Inspection Analytics
The system can also track the number of detected defects during an inspection.
The total number of detected defects can be represented as:
\(N = \sum_{i=1}^{n} d_i\)
where (N) represents the total number of detected defects.
The average detection confidence can be represented as:
\(C_{avg} = \frac{1}{n}\sum_{i=1}^{n} C_i\)
This provides a simple measure of the overall confidence of the AI detections during an inspection.
System Architecture
                    INFRA GUARD AI
                          |
                          v
                  +---------------+
                  |   Dashboard   |
                  +-------+-------+
                          |
                          v
                  +---------------+
                  |    FastAPI    |
                  |    Backend    |
                  +-------+-------+
                          |
              +-----------+-----------+
              |                       |
              v                       v
       +-------------+          +-------------+
       | AI / YOLO   |          |  Database   |
       | Detection   |          |   Storage   |
       +------+------+          +-------------+
              |
              v
       +-------------+
       |   Defect    |
       |  Detection  |
       +------+------+
              |
              v
       +-------------+
       | Risk Score  |
       | & Severity  |
       +------+------+
              |
              v
       +-------------+
       |   Alerts    |
       +-------------+
              |
              v
       +-------------+
       | Monitoring  |
       | Dashboard   |
       +-------------+
Built With
- computervision
- earlywarningsystem
- fastapi
- infrastructuremonitoring
- machine-learning
- opencv
- predictivemaintenance
- riskassessment
- yolo

Log in or sign up for Devpost to join the conversation.