-
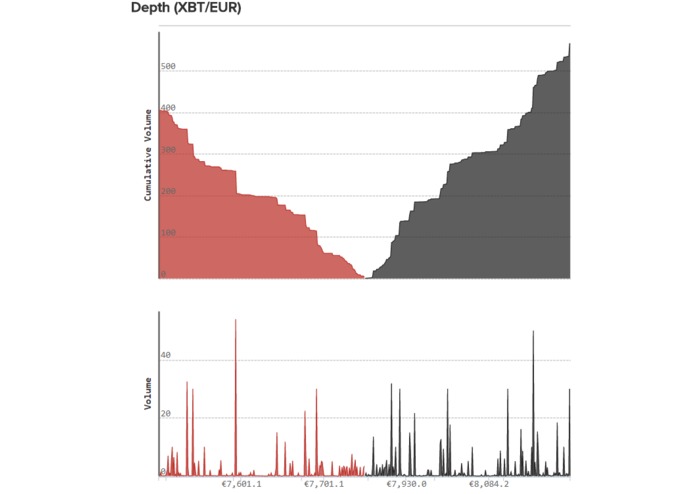
4 graphs from the information
-
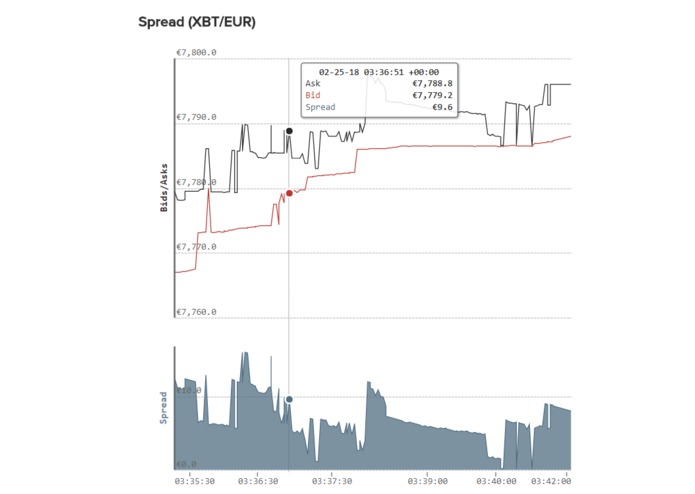
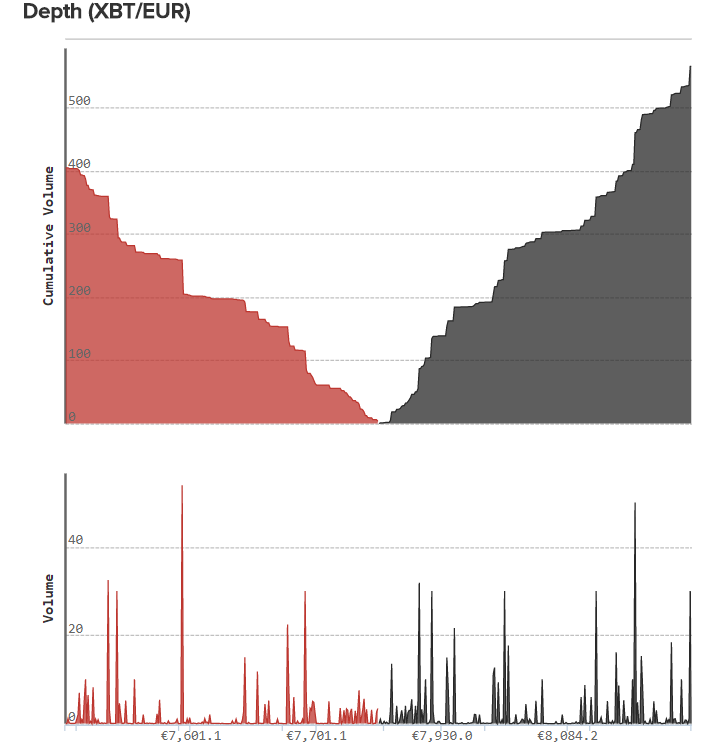
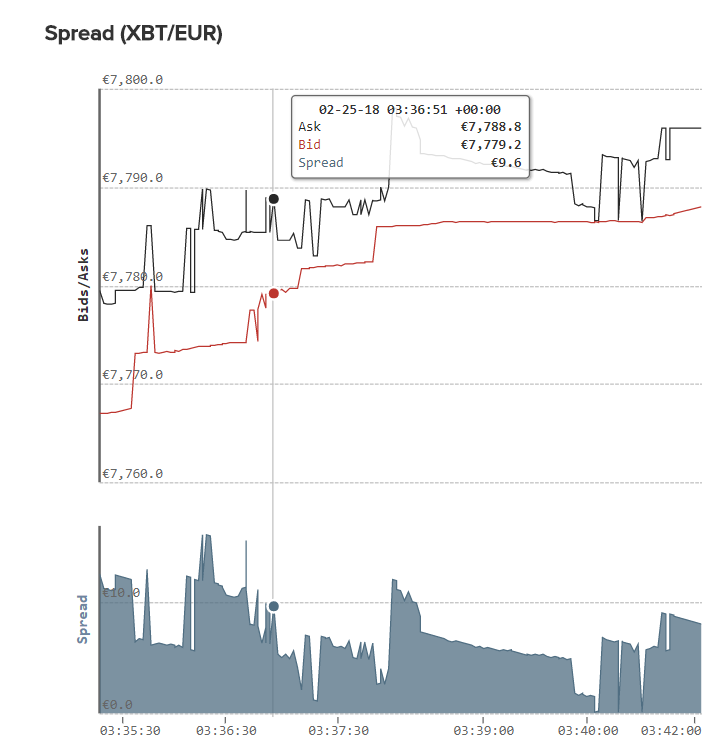
Was originally going to be make via the windows command line, but doing this in python was much easier After almost 3 hours wasted, I decided to make it python. The code was using a process called Quandl and it pings kracken servers. The servers gave out raw information of the Cryptocurries price. The raw data looks like this: 7,"volume":41.04675217,"quoteVolume":44620529.546246,"weightedAverage":9.1e-7},{"date":1428624000,"high":9.4e-7,"low":7.1e-7,"open":9.2e-7,"close":7.4e-. When this data is processed it make a very nice graph.
