-
-
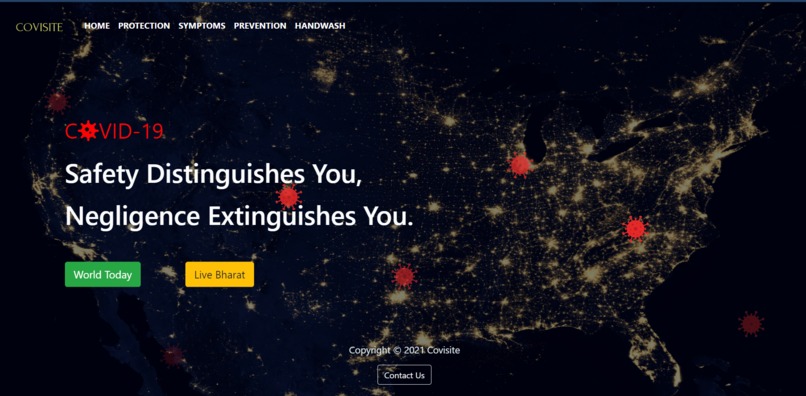
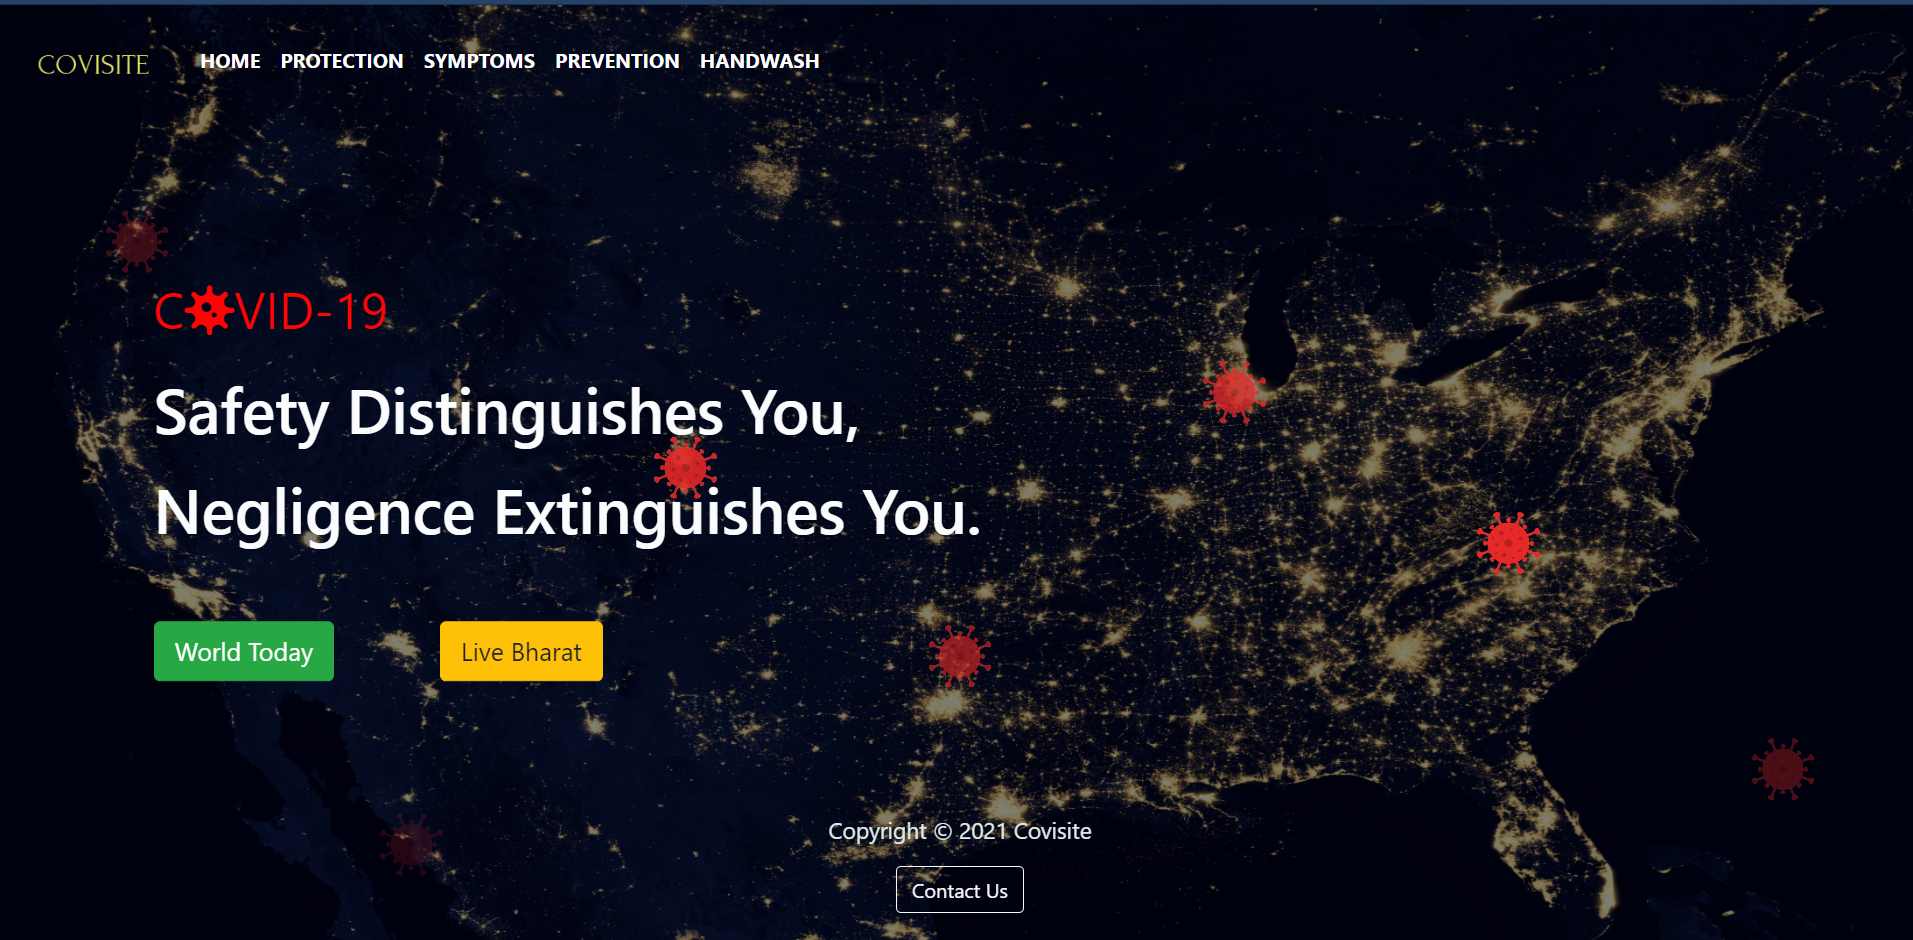
LANDING PAGE
-
PROTECTION PAGE
-
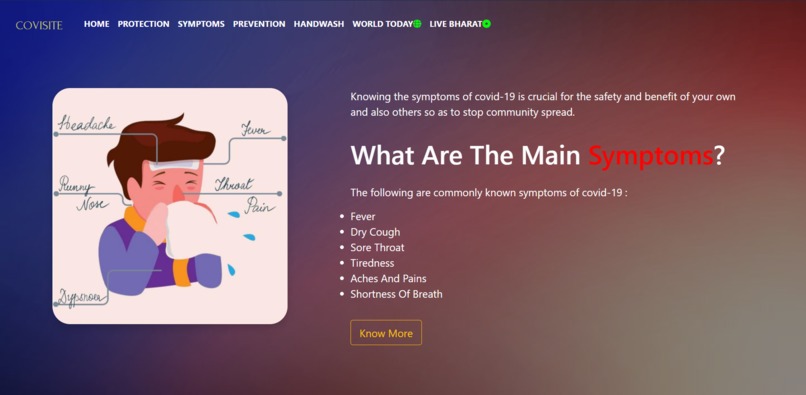
SYMPTOMS PAGE
-

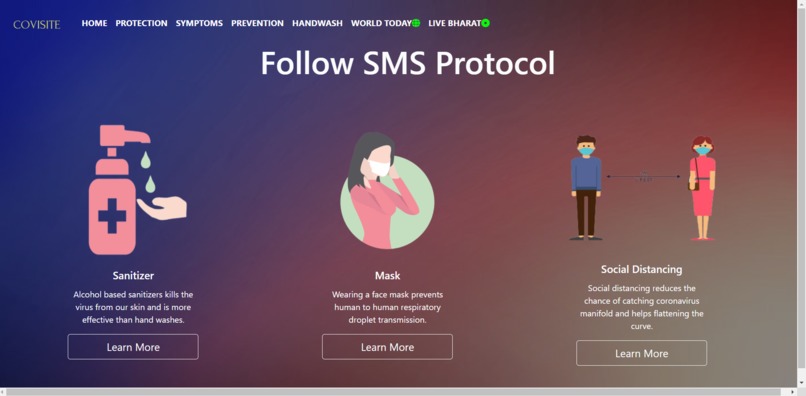
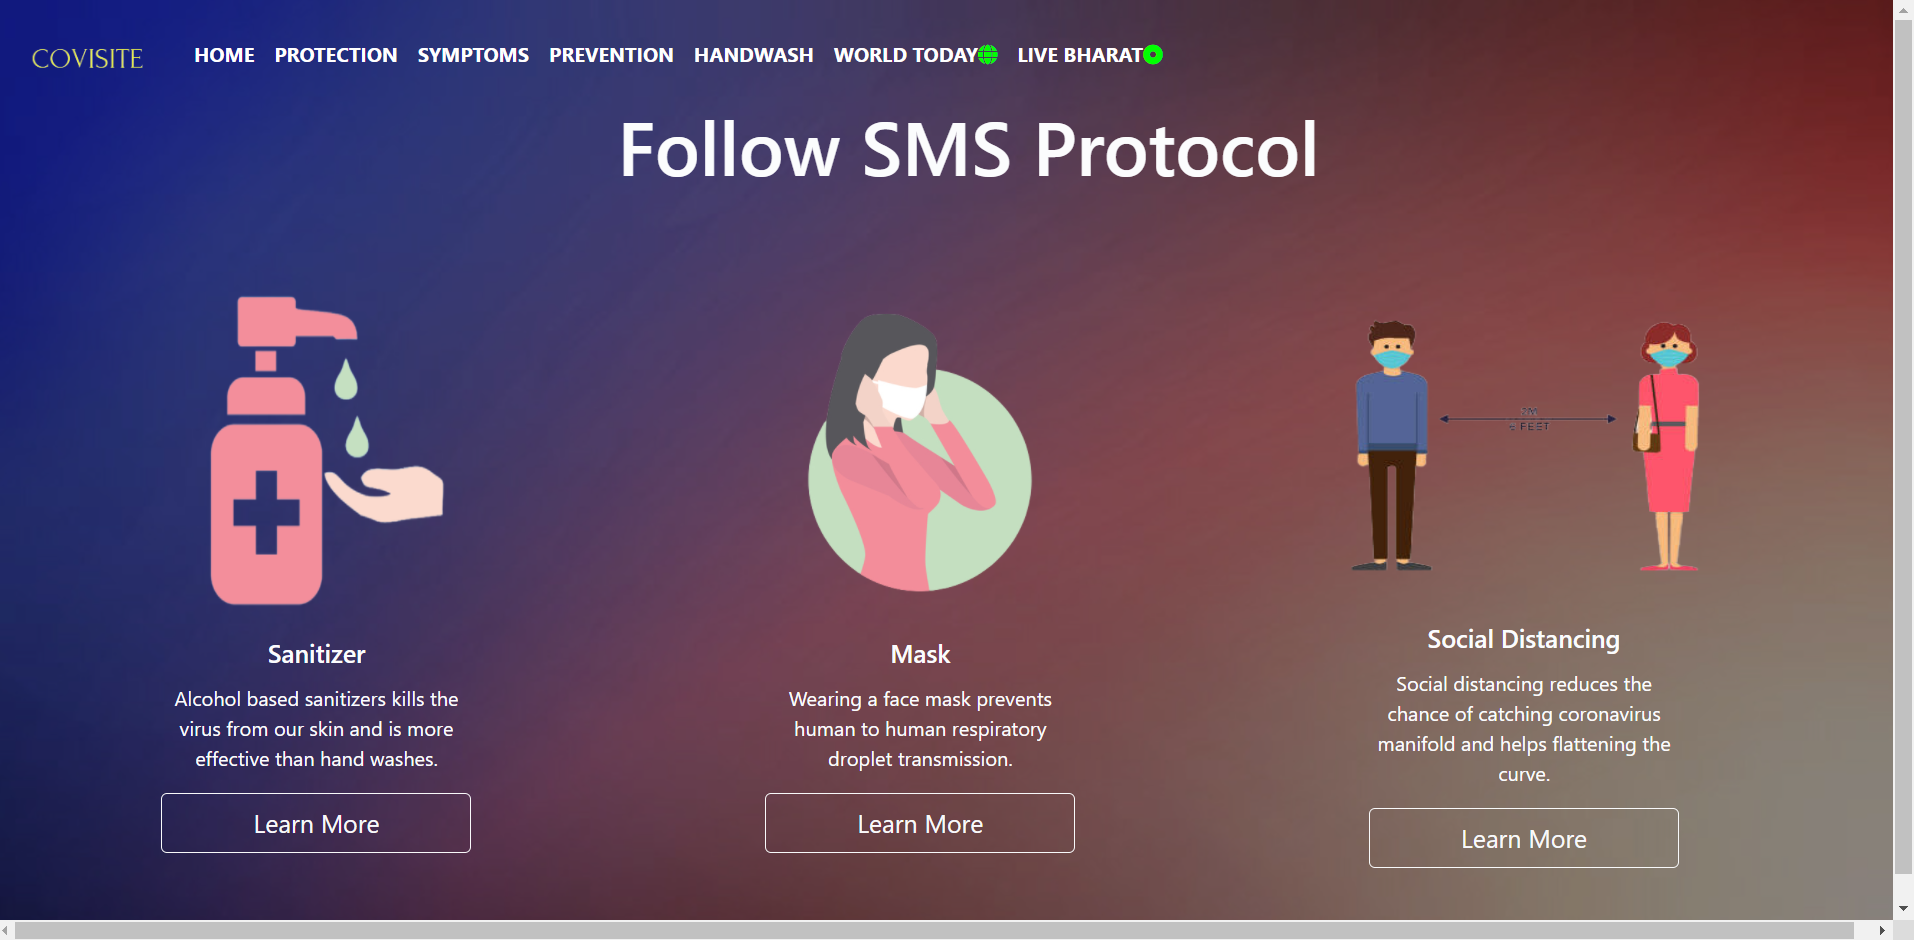
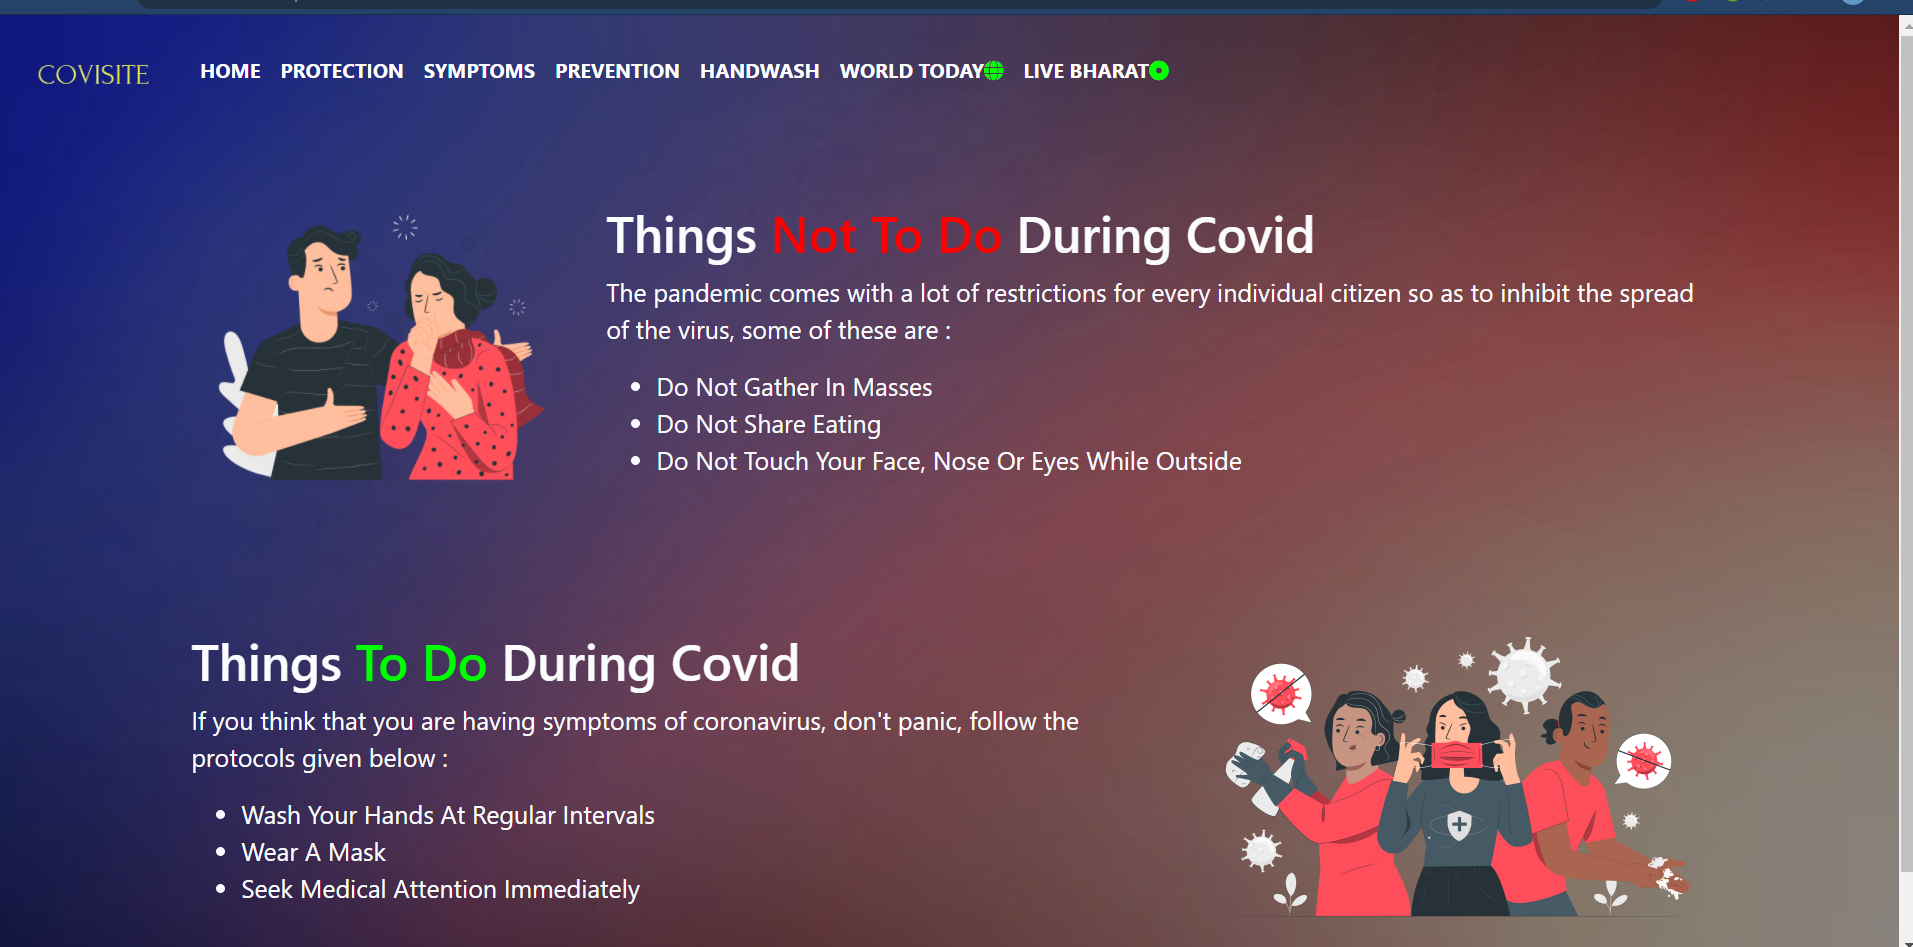
PREVENTION PAGE
-
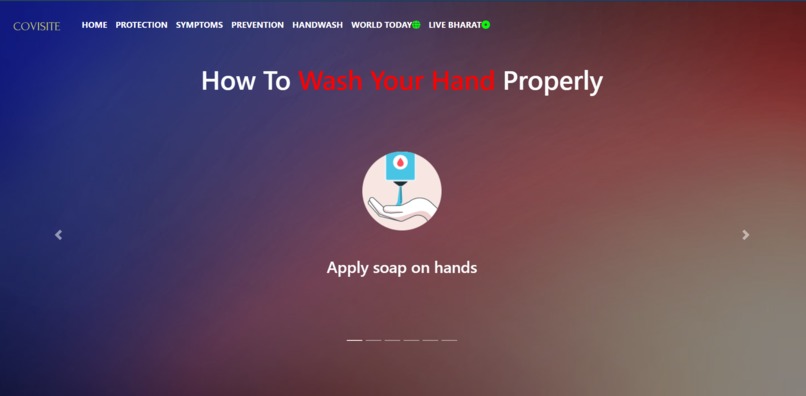
HANDWASH
-
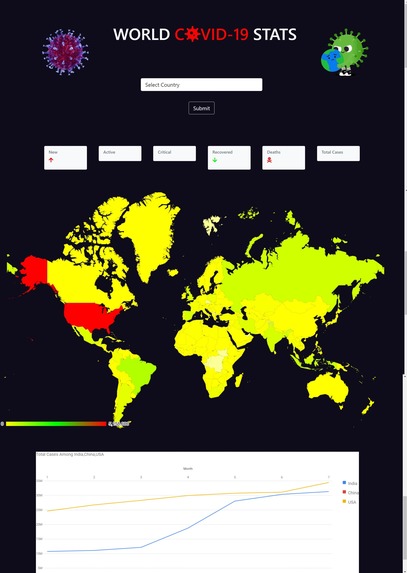
WORLD LIVE STATUS
-
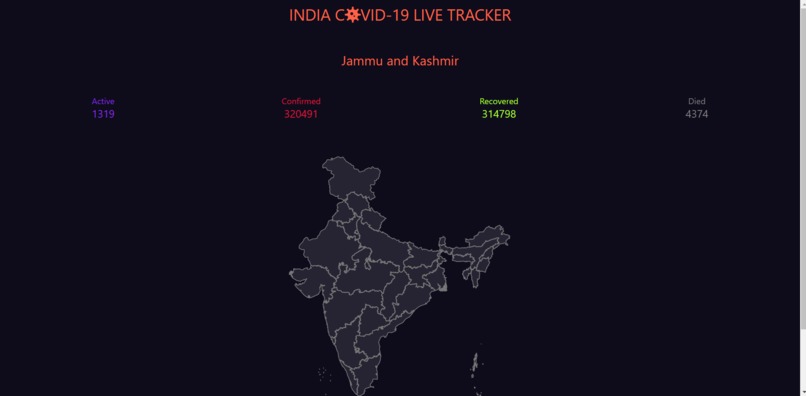
INDIA LIVE STATUS
-
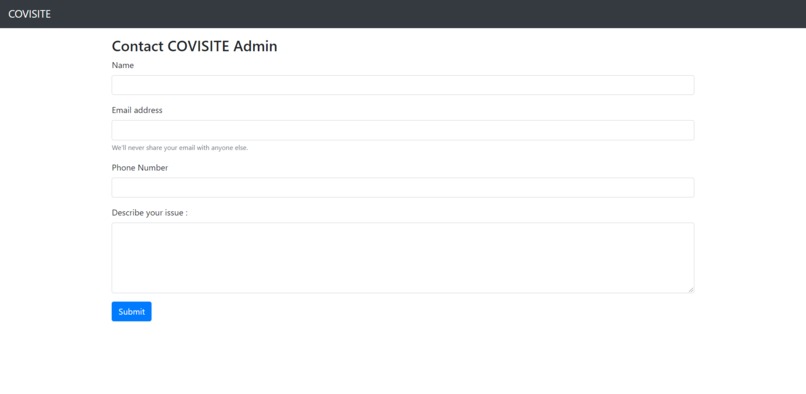
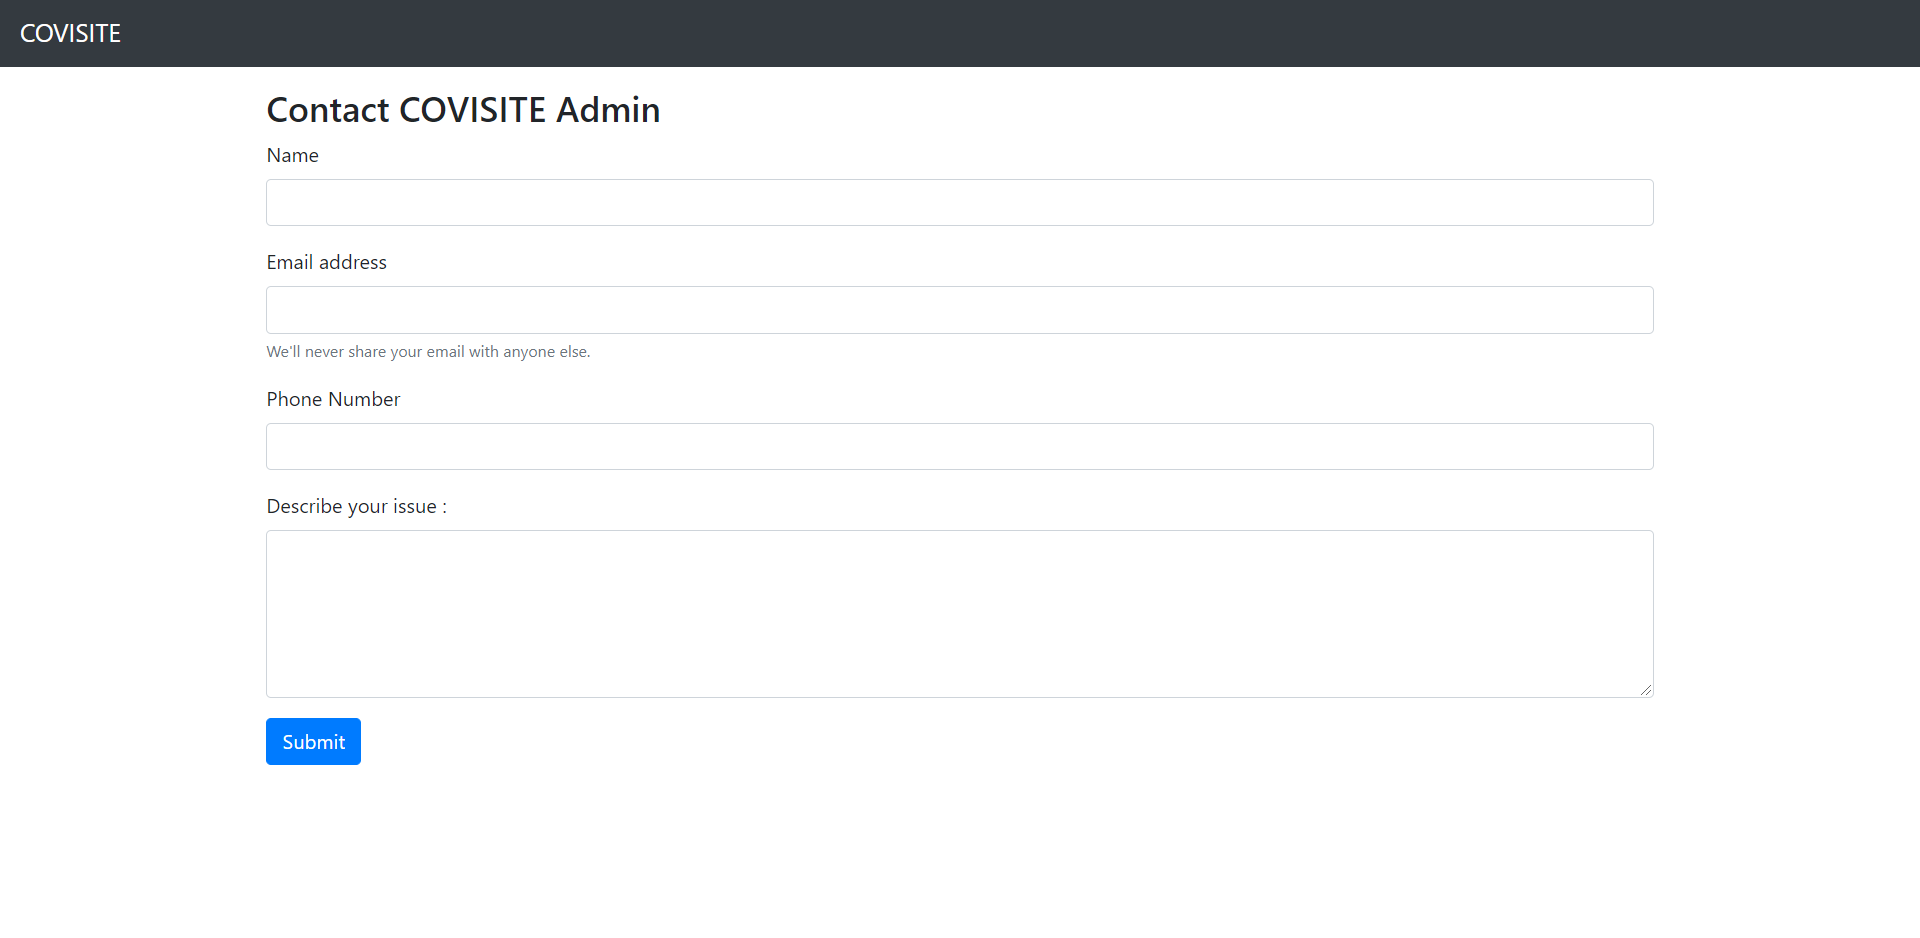
CONTACT US PAGE
-
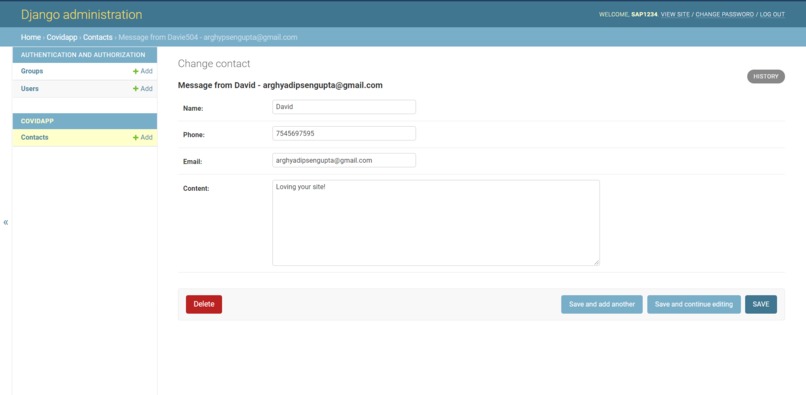
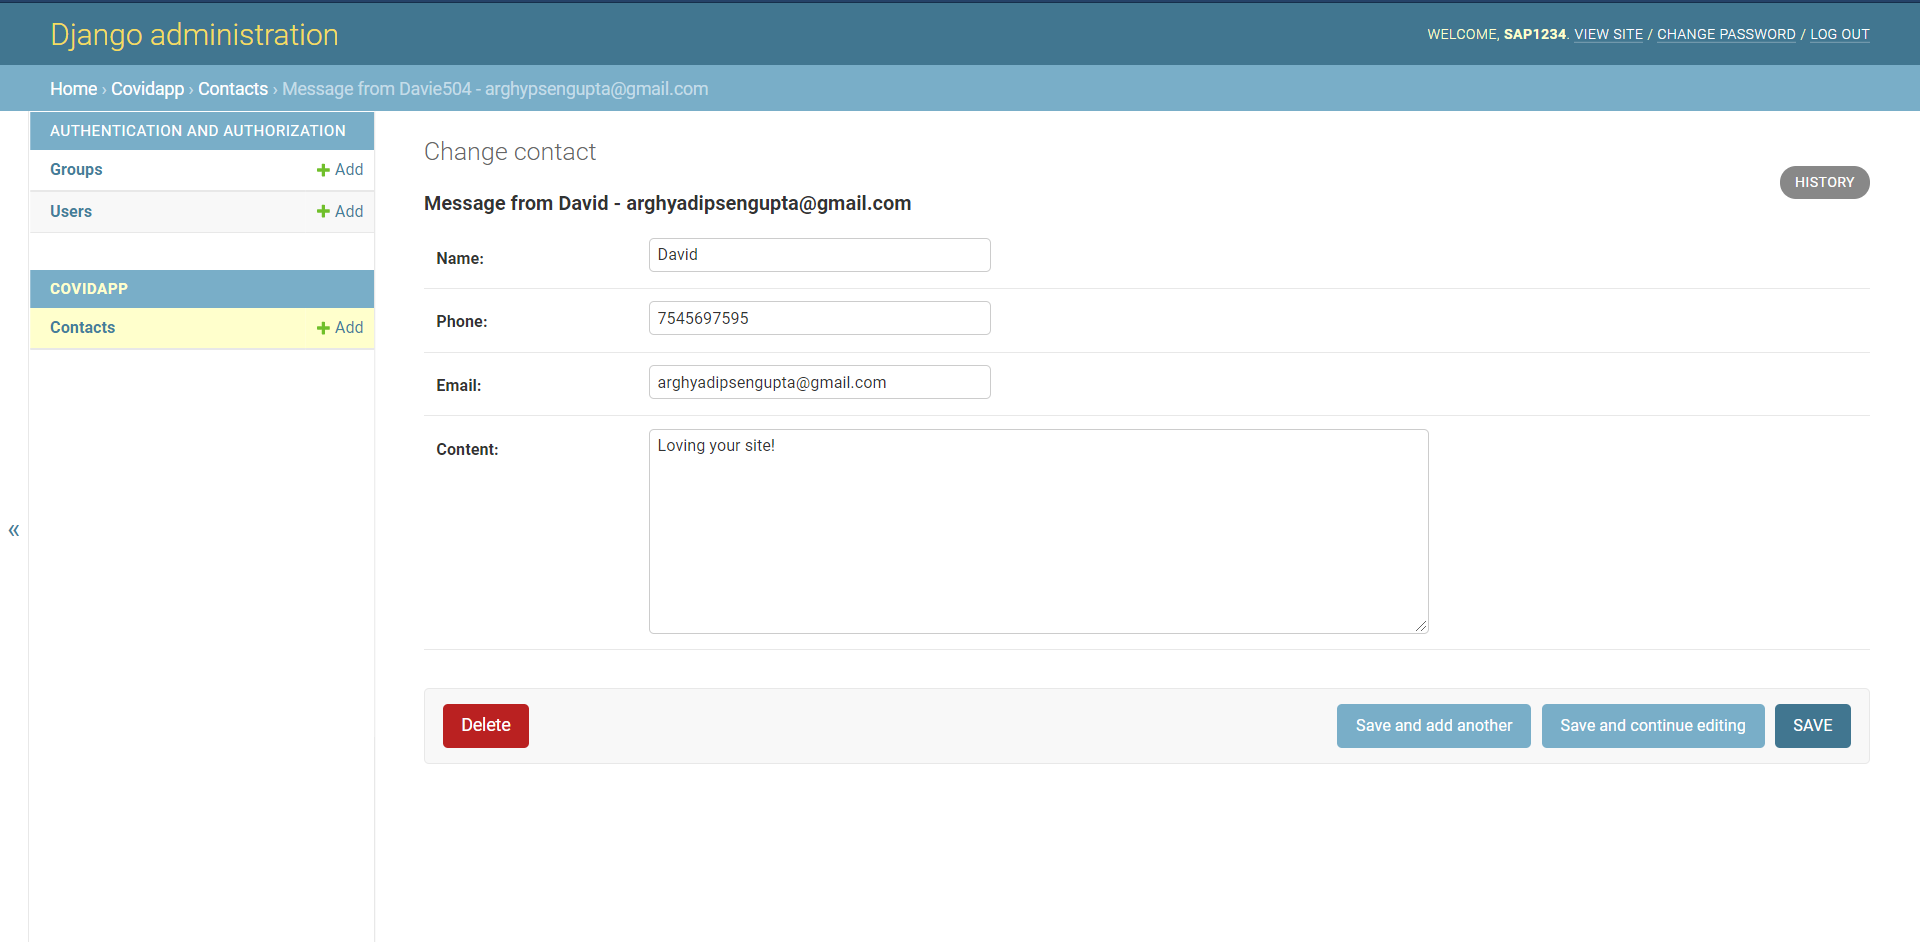
ADMIN PAGE (PRIVATE TO US)


Inspiration
COVISITE is a webapp designed for tracking live covid-19 data, depicting the number of cases worldwide. COVISITE also provides information about the symptoms of the virus, ways of preventing a community spread and personal protection against it.
What it does
1) It gives basic info about COVID-19 & how to rehabilitate it
2) It also helps in spreading awareness about the general protocols to be followed during the pandemic.
3) It also shows the live COVID-19 status around the globe about the new cases, critical cases, deaths, etc.
4) After that, we tried to show the state-wise data across India with a responsive map.
5) Lastly, if anyone tries to give a feedback about our webapp, they can do the same through the Contact Us button & their response will be stored in our database.
How we built it
1) First of all, we created the front end with the help of HTML5, CSS, JavaScript.
2) With the help of Django, we fetched Dynamic API Data & made a database with the help of SQLlite3
3) We visualized the data through interactive maps and graphs using Google Geo-Charts & Line-Charts
Challenges we ran into
1) Deploying Our webapp into Heroku
Accomplishments that we're proud of
1) We tried our best to give a rough sketch of COVID-19 data to people.
2) We successfully made the entire webapp within 30 hours.
What we learned
1) Making Animations with CSS
2) Creating Database with Django
3) Fetching Dynamic API Data
What's next for Covisite
1) We'll integrate global vaccination data along with the existing covid statistics.
2) We'll categorize locations on the basis of their containment zones.


Log in or sign up for Devpost to join the conversation.