Inspiration
We were invigorated to create a website that could provide people with the required information they need to know with just a few clicks. We aim to assist the people amidst this pandemic.
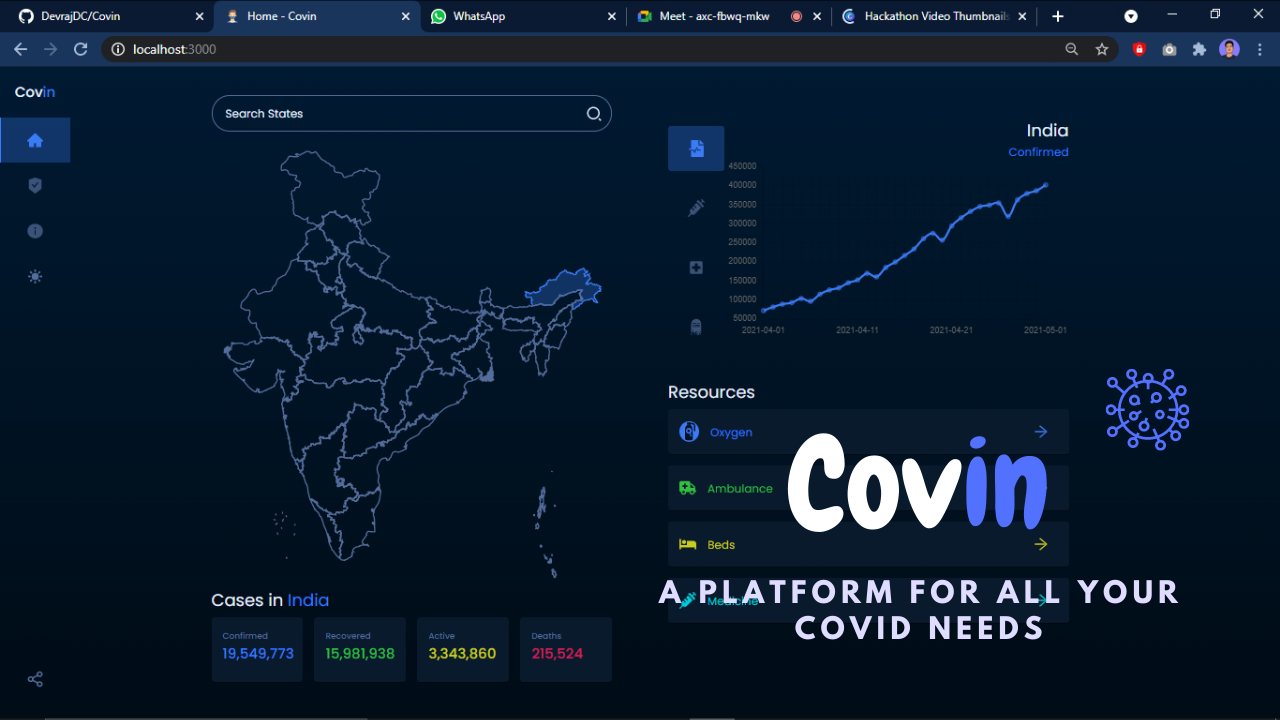
What it does
Our website Covin is a platform that works towards helping people during this pandemic by informing and constantly updating them of the current scenario regarding the number of cases increasing or getting recovered in their state. We can search for any state in the search bar, or even click on any of the states on the map. On clicking on any state it will provide us with the following statistics on the graph. For example, if we click on the state of Maharashtra, this option will show us the number of confirmed cases, the next option will show us the number of people who have recovered from covid, the third option gives us the number of people that have been tested, and the last option provides the statistics about the number of deaths. This section below the map provides the numerical figures of the confirmed cases, recovered patients, active cases, and deaths in the states of the country. On clicking outside the map it gives the statistics for India again. In this section, we see the resources available in the country as well as in the states.
How we built it
While designing the project, we thought about which frameworks and APIs we could use. The experience of building this solution was indeed a result of the team effort. By following the Scrum framework, we were able to stay aligned through daily stand-ups, planning sessions, refinements, and reviews at the end of the day.
Challenges we ran into
The graph was very hard to implement as the Covid19India API is configured for their website. We used the chart-js library to implement the graph as it was simple to use this, but it was compatible with Vanilla-js only. Hence we used another framework, React-Chart-JS-2 which was used for the line graph. Once UI design was done we emphasized the buttons and other tabs, to achieve a smooth Ux we used Material UI for buttons, sidebars, and other components.
Accomplishments that we're proud of
We are proud of the solution we built in how we hope it can contribute to society. We tried to construct our solution as flexible and scalable as possible. We are proud that we could use our experience to build a solution that could benefit humanity and contribute to a better tomorrow.
What we learned
We learned how to implement graphs using React-chart-js-2, how to solve a real-life problem in the present situation, and the complexity behind planning an appropriate website to meet people's needs. We all worked together on designing our Website on Figma, helped correct the flaws in each other's work. We had meets lined up to discuss the project which enhanced our communication skills. We found the need to support our community and learned how to rift the bridge between technology and humanity.
What's next for Covin
We also have future plan ready to work on the search for the availability of resources where People could visit this site and check in the status of the resource availability according to the states or district wise. Upon clicking over a particular state, you would see the current status of all the resource availability. On clicking over a particular resource you would be taken over a page where u can search the resource availability, the details of the retailers or service providers which you could than use to satisfy your needs.
Built With
- chart-js
- material
- react
- react-chart-js-2
- react-virtualised
- ui


Log in or sign up for Devpost to join the conversation.