-
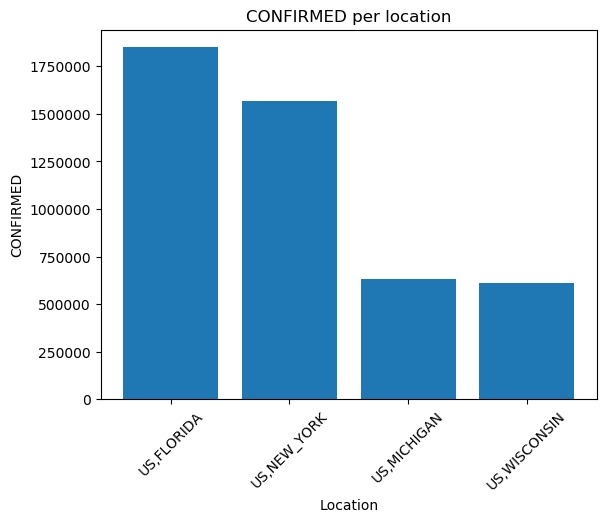
@CovidStatBot graph confirmed @ us,florida us,new_york us,michigan us,wisconsin
-
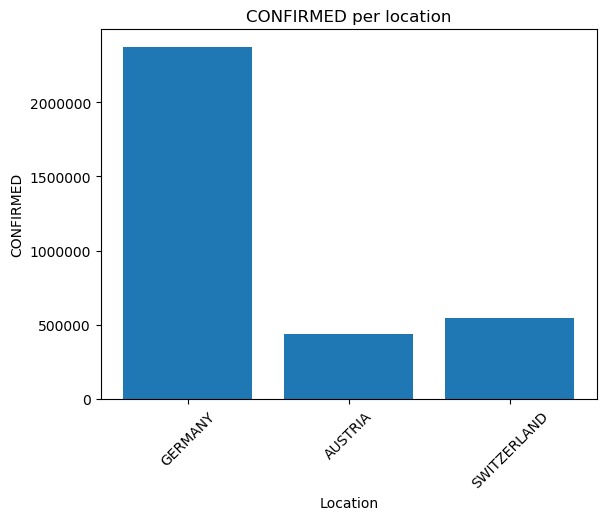
@CovidStatBot graph confirmed @ germany austria switzerland
-
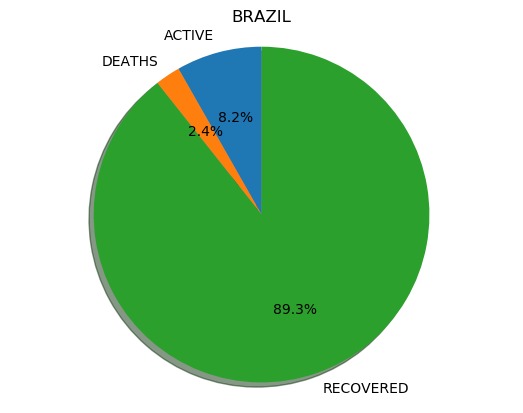
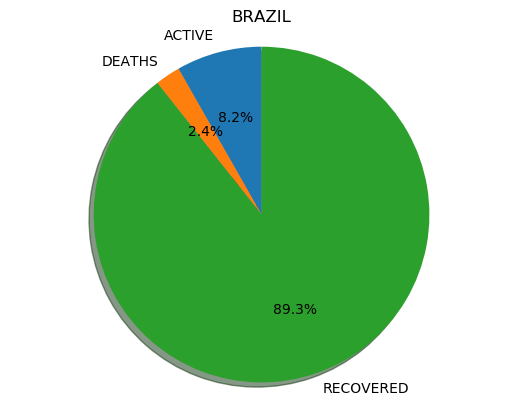
@CovidStatBot graph active deaths recovered @ Brazil
-
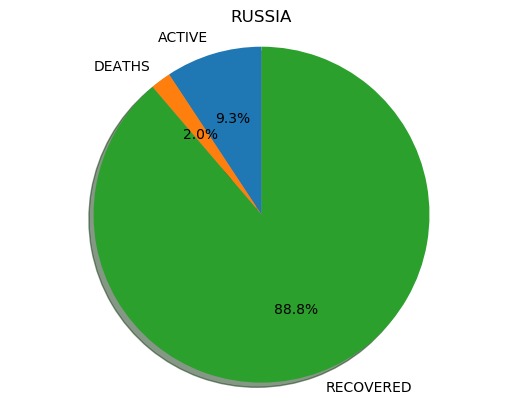
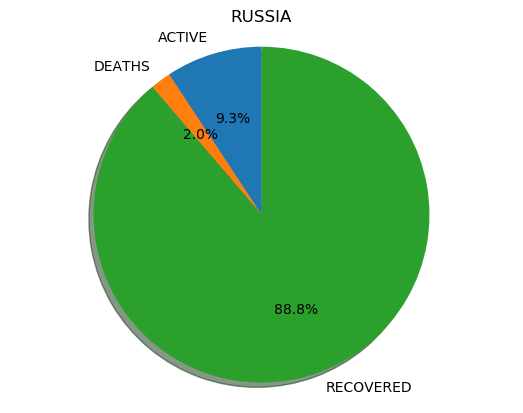
@CovidStatBot graph active deaths recovered @ Russia
-

@CovidStatBot restrictions michigan
-
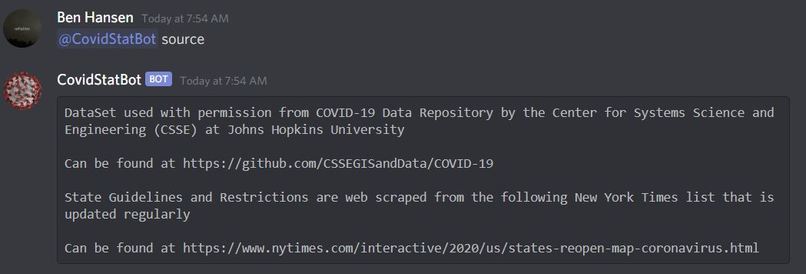
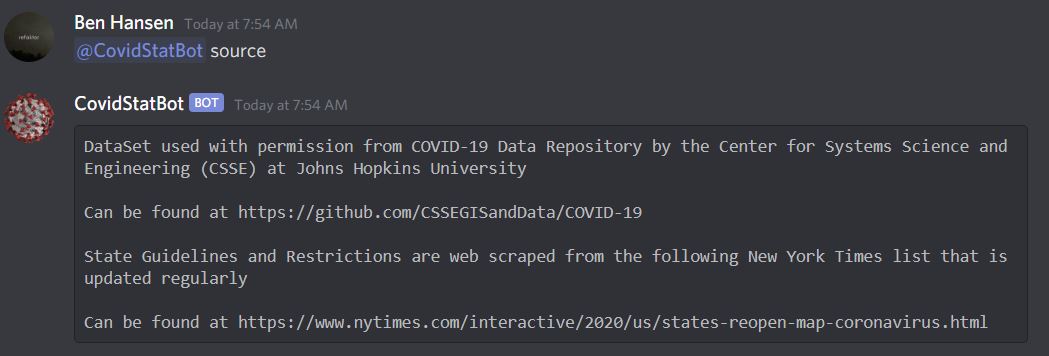
@CovidStatBot source


Inspiration
During this Covid-19 pandemic there's been a rise in information about Covid-19 that could be potentially misleading. Although there are plenty of Covid-19 statistics and infographics out there, we wanted to give the average discord user the power to create their own.
What it does
CovidStatBot uses a database of global Covid-19 data to pull custom requests from users. CovidStatBot can also generate custom charts and graphs from their requests.
How we built it
The bot itself is running with Python using the matplotlib, discord, and sqlquery libraries. The backend is an SQL database hosting Covid-19 data aggregated by the Johns Hopkins university. The whole bot is running on a raspberry pi, with a seven segment display that counts the number of commands executed.
Challenges we ran into
We had some issues dynamically querying the database based on user input
Accomplishments that we're proud of
- Finishing the bot
- Graphing functionality
- Flexibility for parsing user input
What we learned
- Python
- Python's Discord and matplotlib libraries
- MySQL
- Data Science
What's next for CovidStatBot
Hopefully, continual improvement! Here are a few features we'd like to add in the future:
- Generate graphs over time to see change
- More data
- Public release / make bot available to other servers
Finally, this bot is not available for public servers at the moment. We want to finish bugfixing and developing it before any kind of public release.
Built With
- discord
- matplotlib
- python
- raspberry-pi
- sql
- sqlquery


Log in or sign up for Devpost to join the conversation.