-
-
The new layout and theme management
-
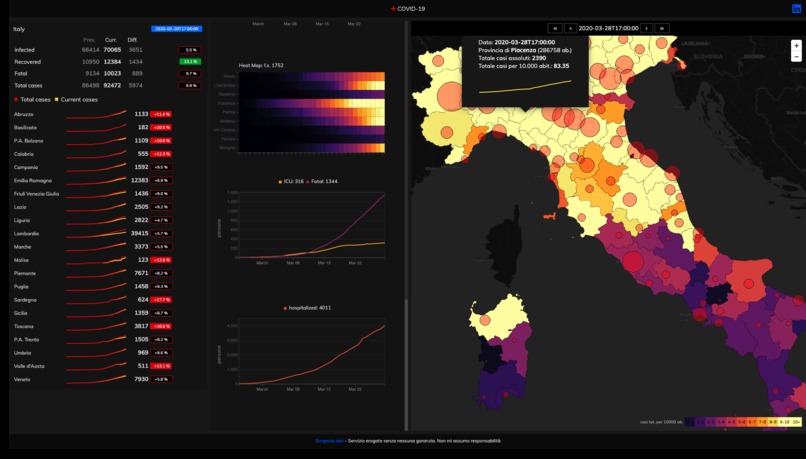
GIS
-
UI
-
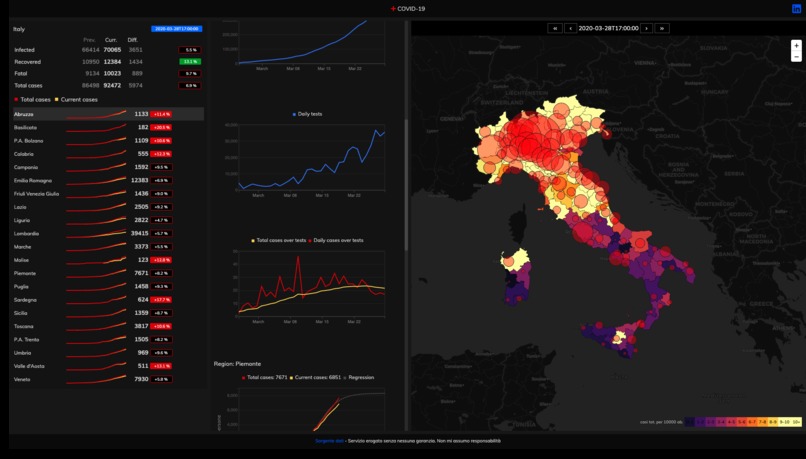
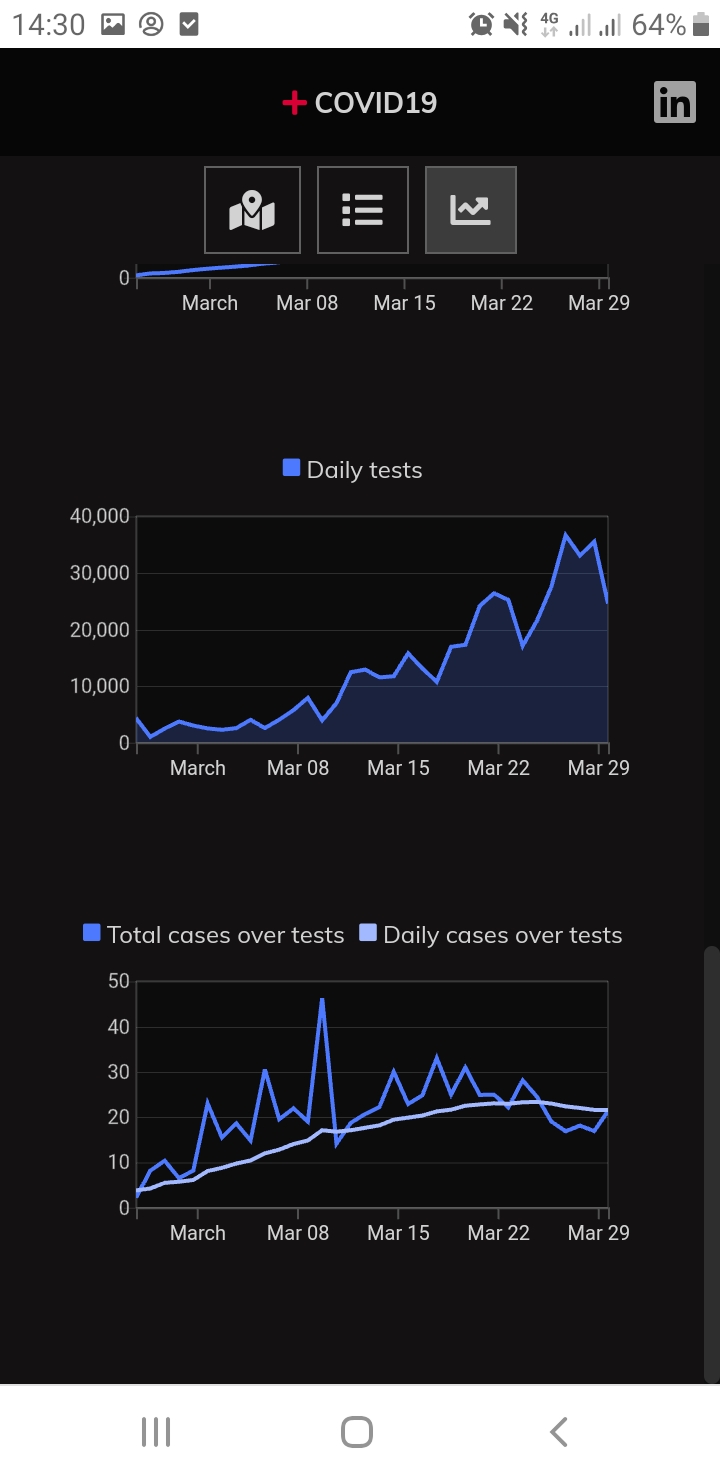
Tests monitoring
-

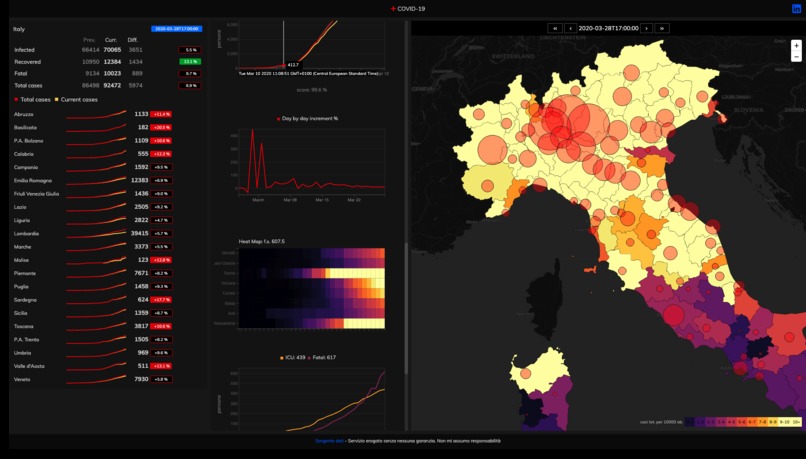
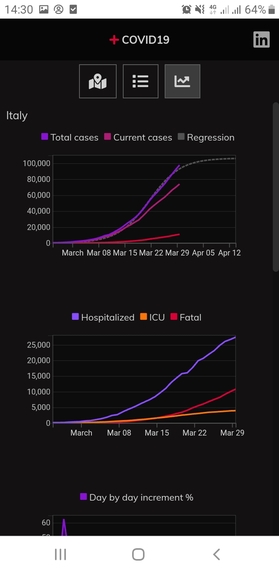
country charts
-
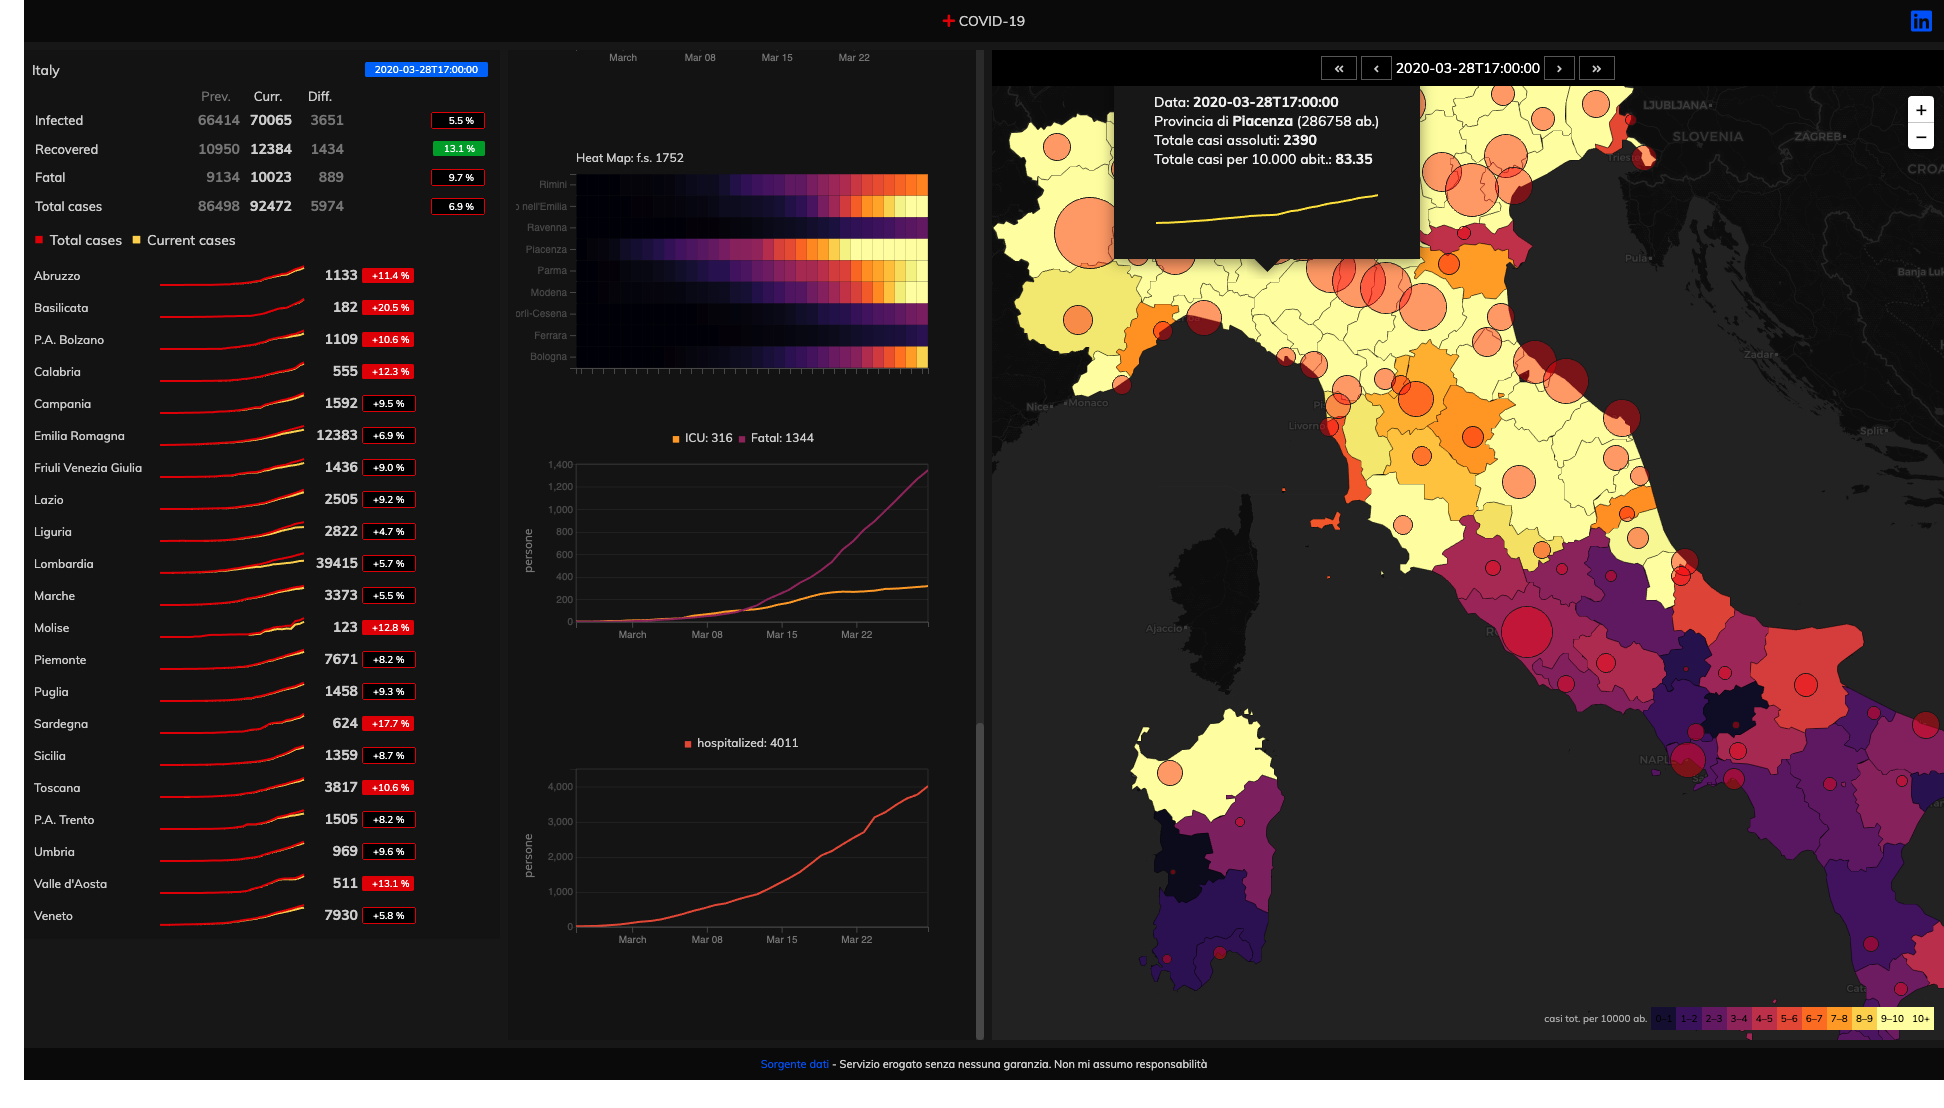
county view
-
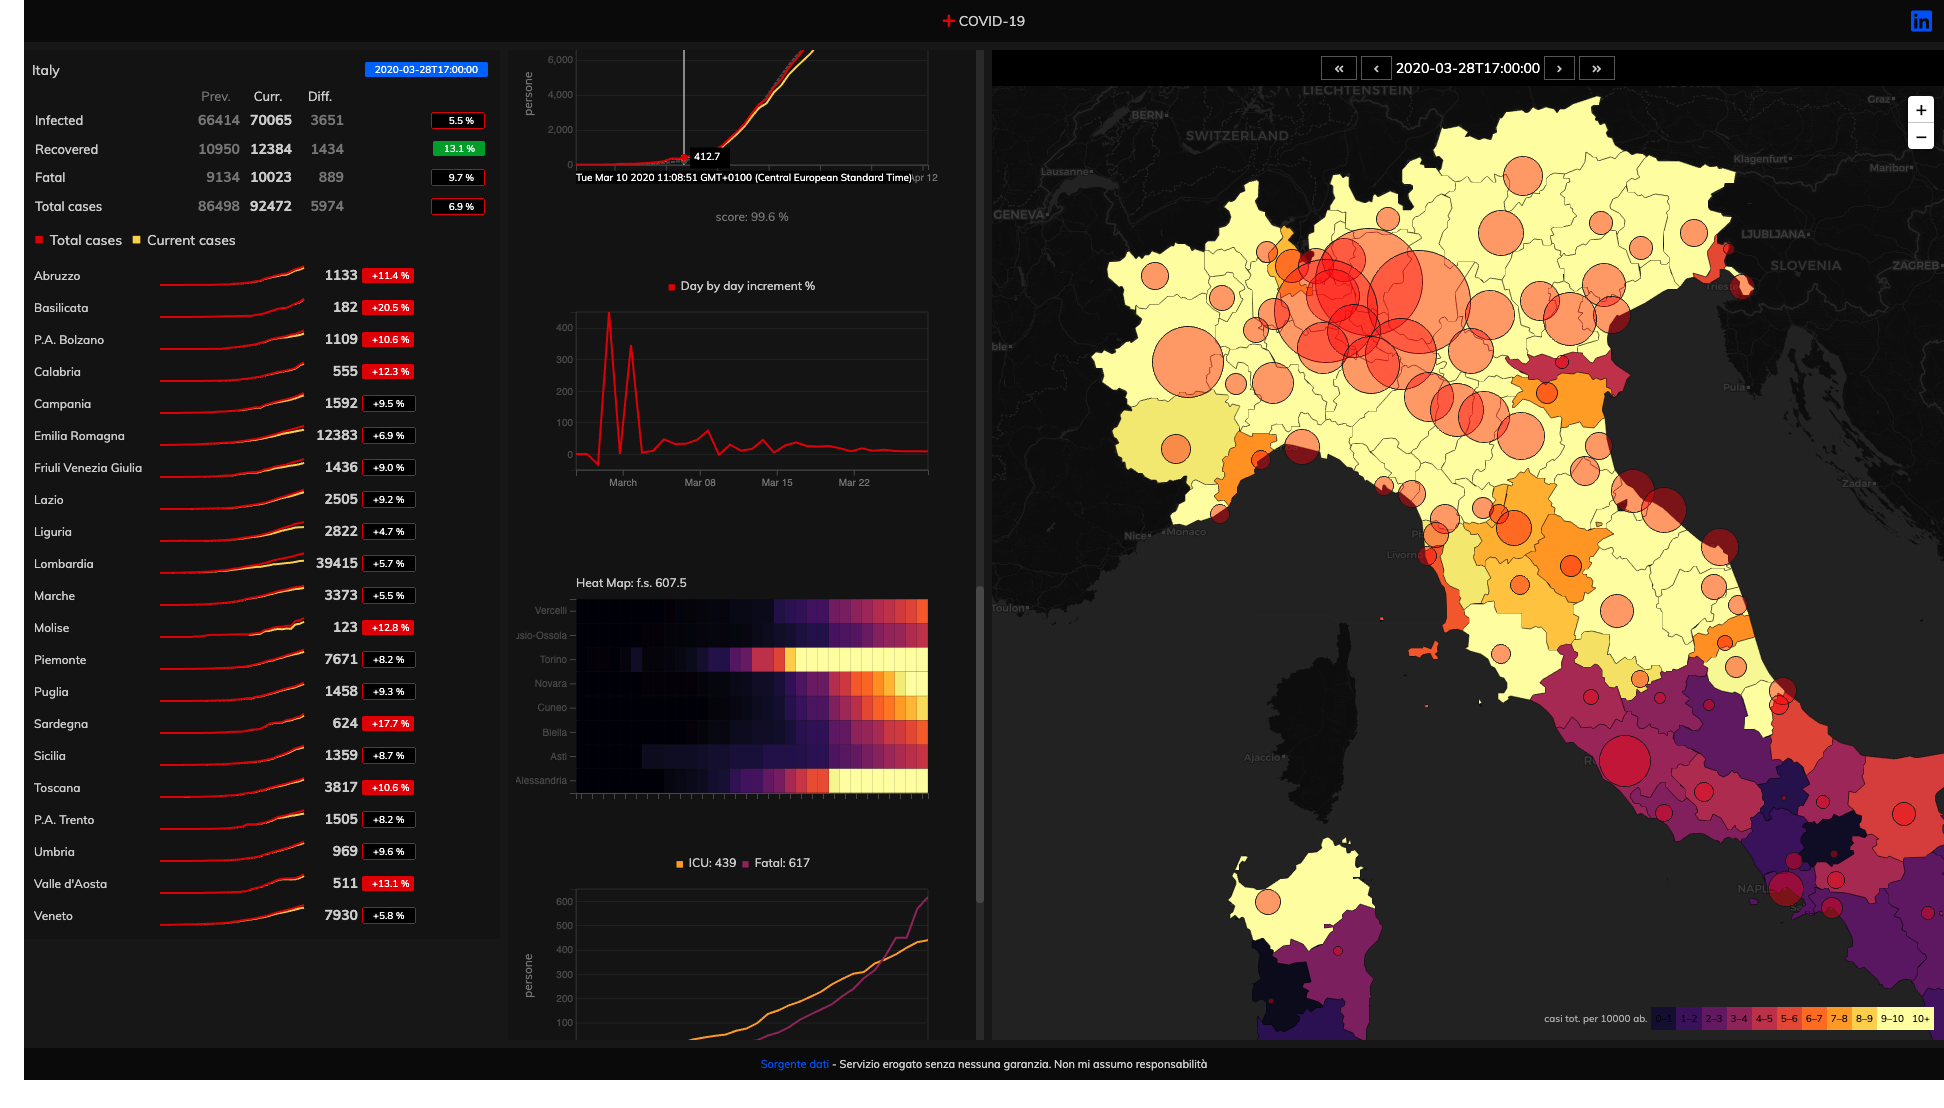
region view
-

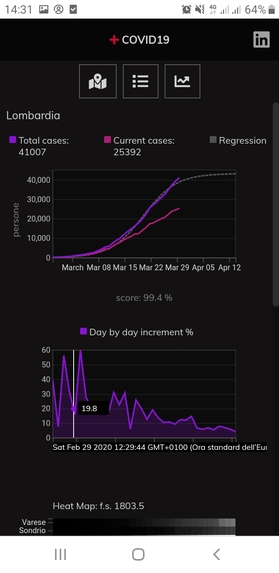
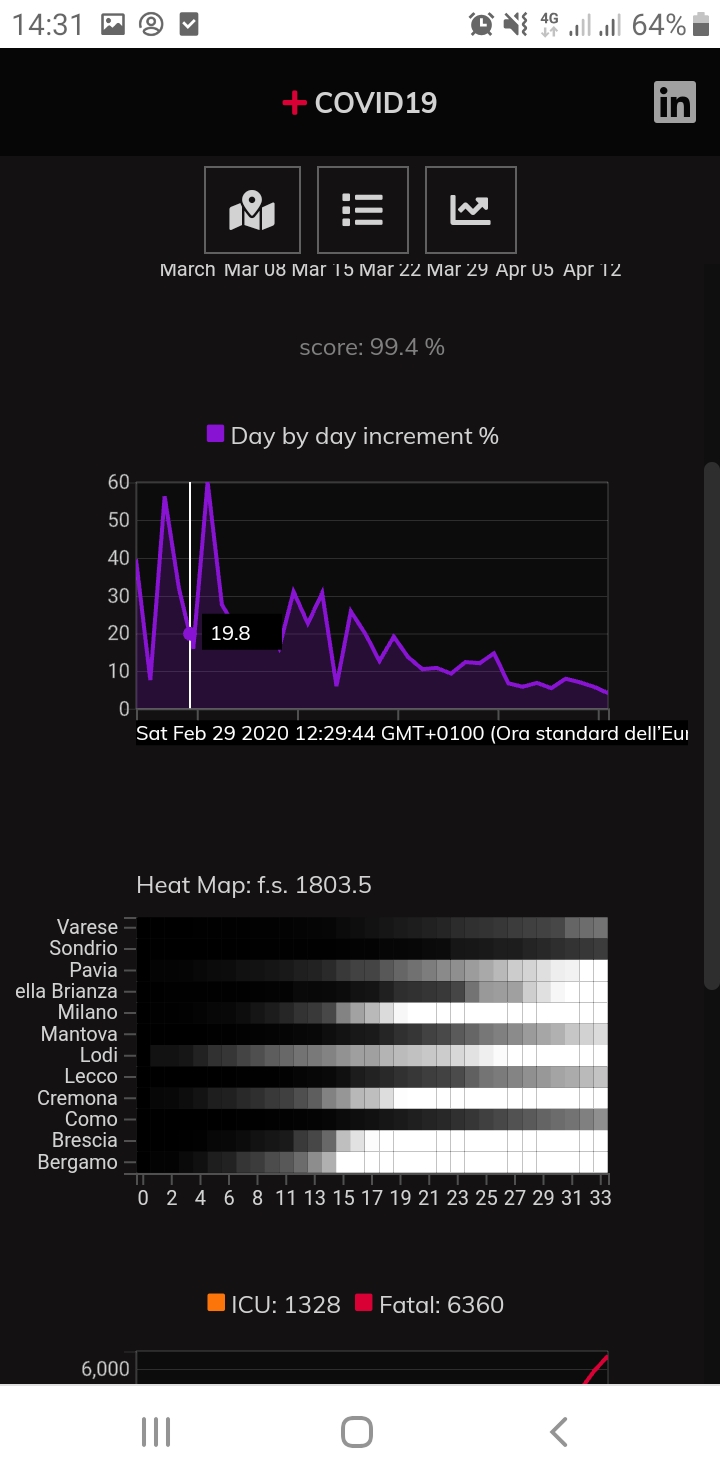
regione charts
-

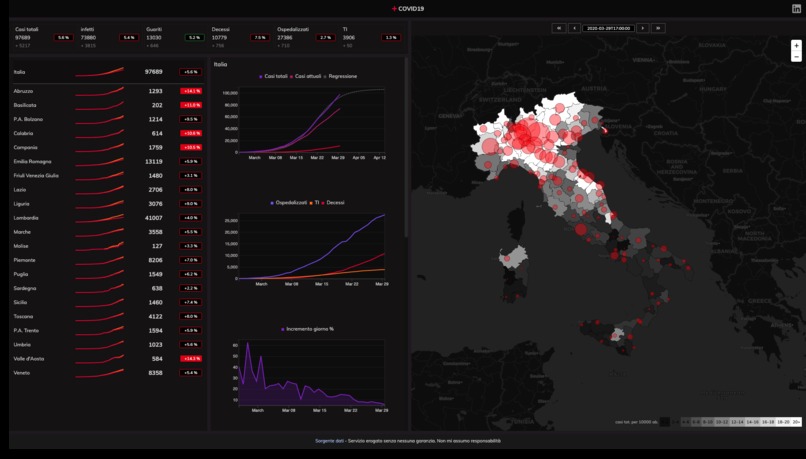
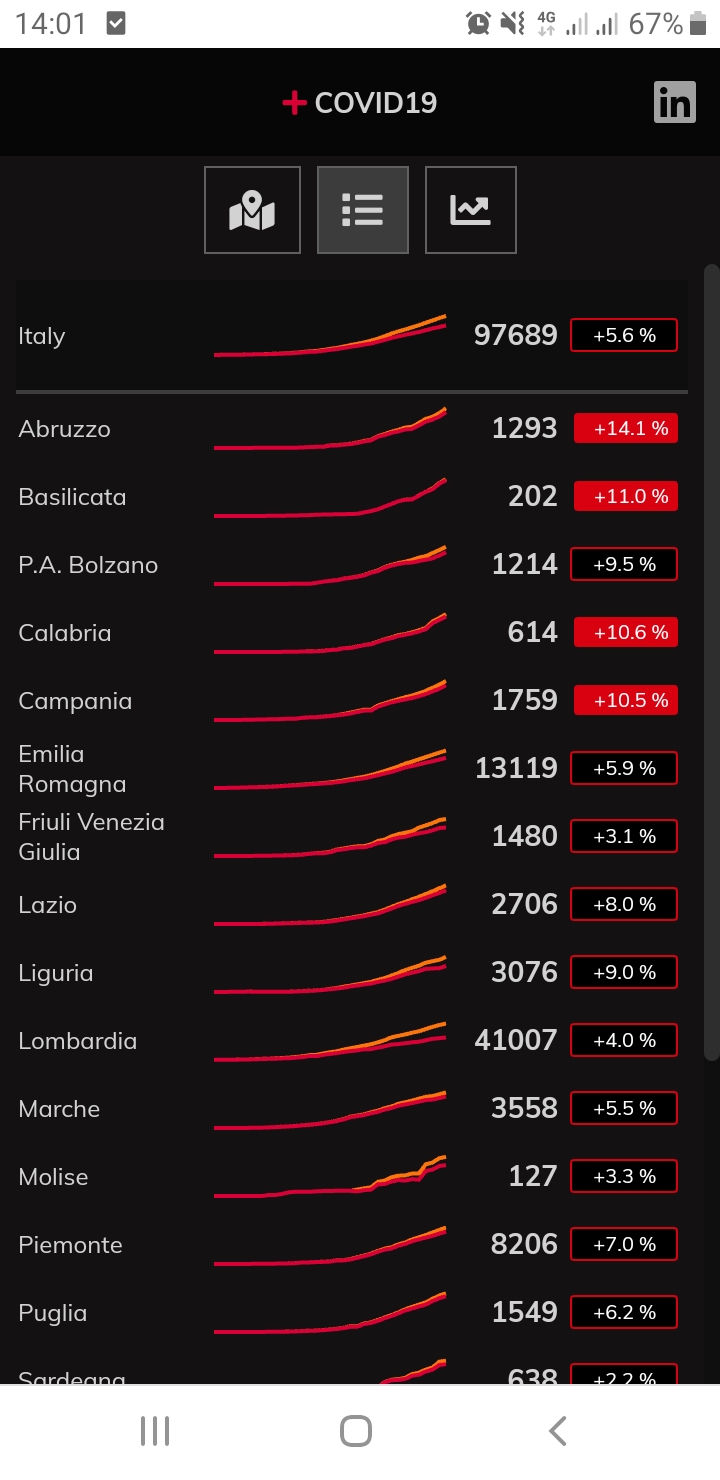
list view
-

map view


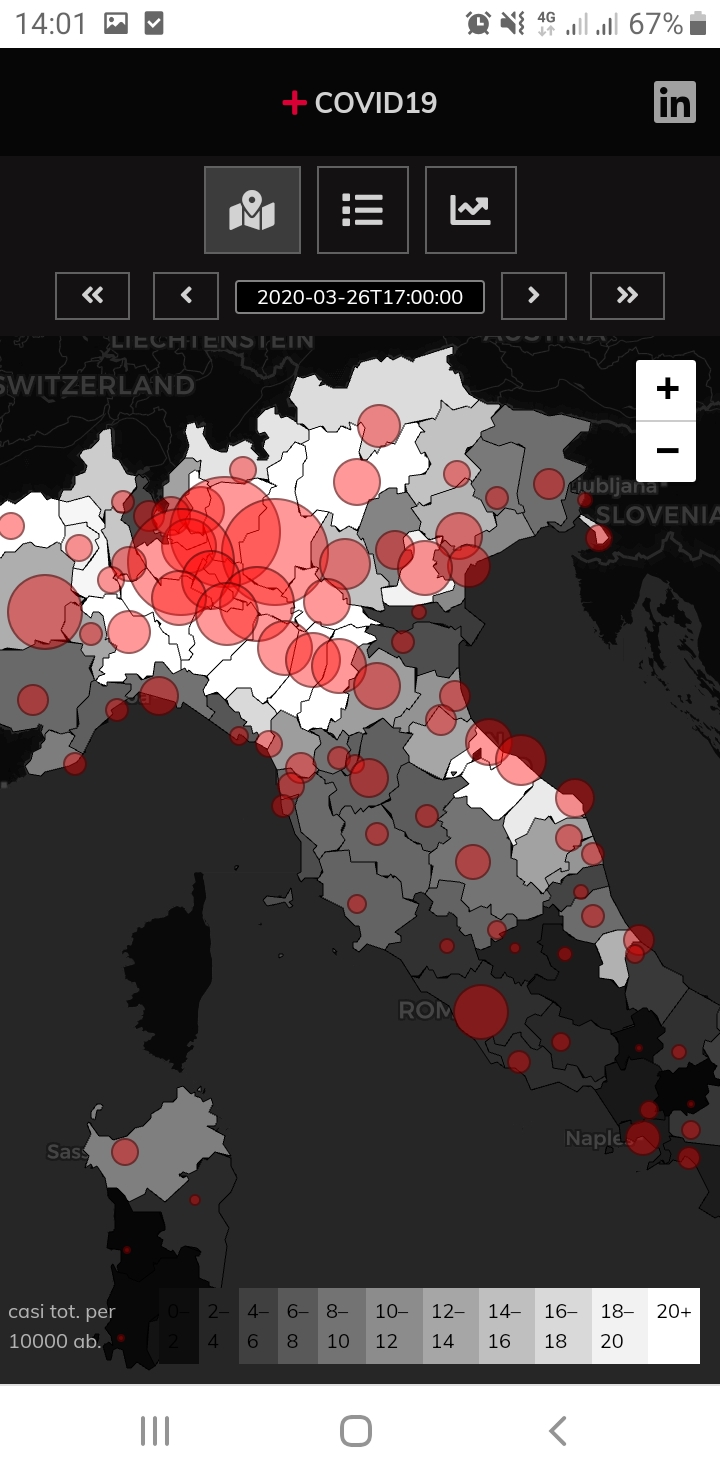
Inspiration
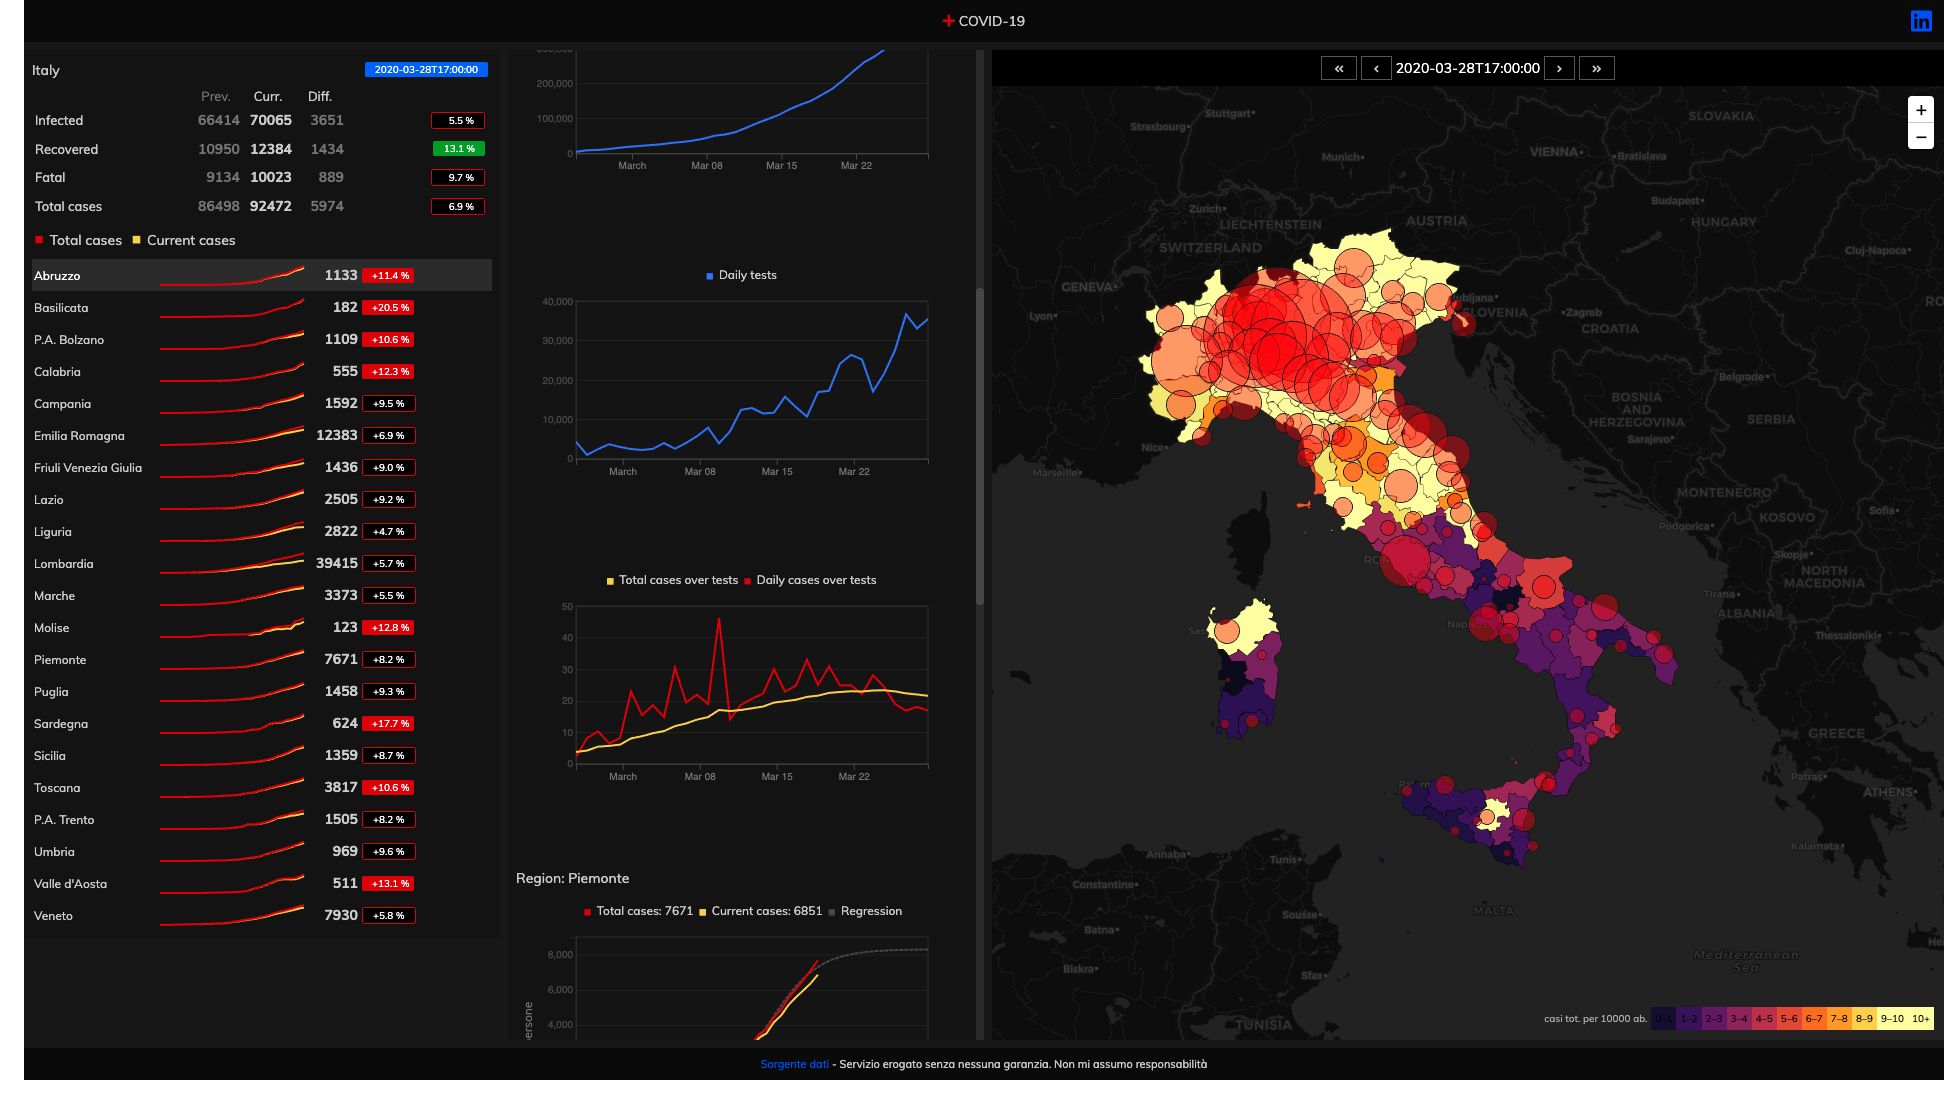
The COVID19 Italian outbreak has a huge impact on our lives and our economy. Closed in isolation, I decided to develop this dashboard. The goal is to develop a good predictor (more than one model) and a data visualisation user interface that surely could help people and authorities to take the right actions to prevent failures.
What it does
It collects data from various sources. The user interface processes and visualises data. A prediction module serves data forecasting.
How I built it
I built it with Python (for the data science part) and Javascript.
Challenges I ran into
Find a good model to forecast data. Currently, I've developed 3 models to forecast scenarios:
- Logistic
- Exponential (early stage)
- SRI (to be deployed)
- SRI-F (to be deployed) The modelling part need to be improved, but it works.
Accomplishments that I'm proud of
The tool has been developed in a short time and it is jet available online
What I learned
I've learned some epidemiological models, like SRI, SEIR, SIR-F, etc.
What's next for Virus Clusters Prediction
Data collection, visualisation and predictors need to be improved to take the project to the next level.
Machine learning
I want to inspect novel machine learning techniques. To do that we need to gather as much data as possible from this and other epidemic events.
Data sources
I need also reliable and live data sources. Block-chain technology could be used to build a distributed, tamper-proof database. Currently, data sources are separated and every country maintains a specific record. It is very important to form a single source of truth, in sync with labs and react as soon as possible to new data.
Data monitoring and Visualisation: A comprehensive alarm system must be developed.


Log in or sign up for Devpost to join the conversation.