Overview of Project
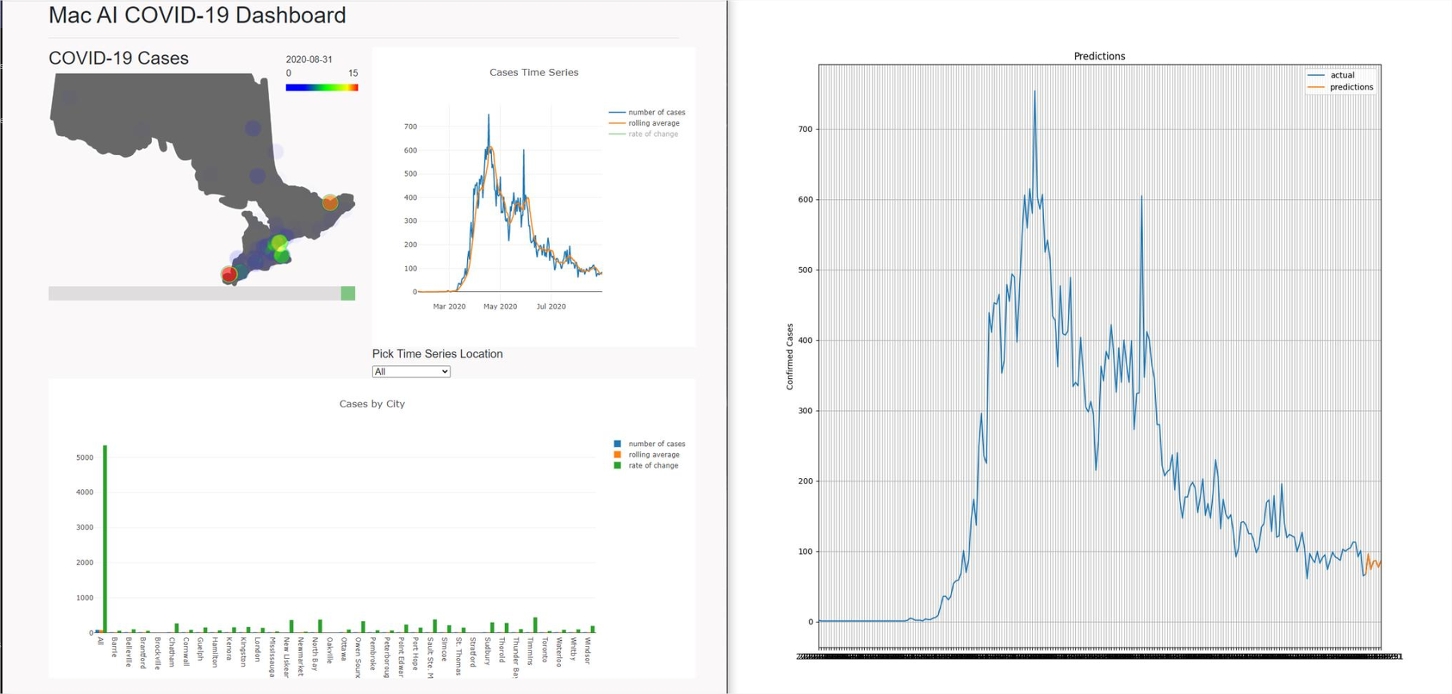
CoviDash is an informative and responsive dashboard for information on COVID cases in Ontario. Using a heatmap and multiple graphs, data can be found for COVID cases in each area, location, and date across the province. Also, using pytorch, predicted case numbers can also be found for seven days past the last available date from the dataset used. The slider under the heatmap can be used to view case data from past, present, and future dates, and any data can be hovered over to see the approximate cases in that given area. The time series chart displays the data over time for each location, giving an idea on what the case curve looks like and what it is predicted to be at over the next week. Finally, the bar graph displays the amount of cases in each location for the date selected on the heatmap, along with its average rate of change.


Log in or sign up for Devpost to join the conversation.