-
-
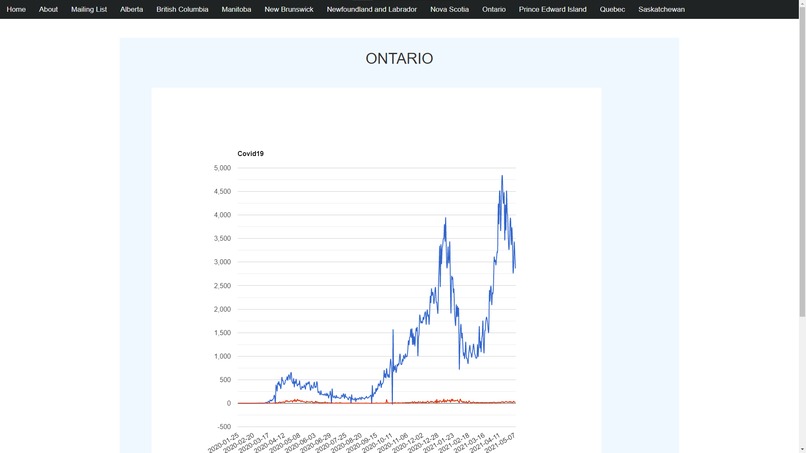
Website Layout
-

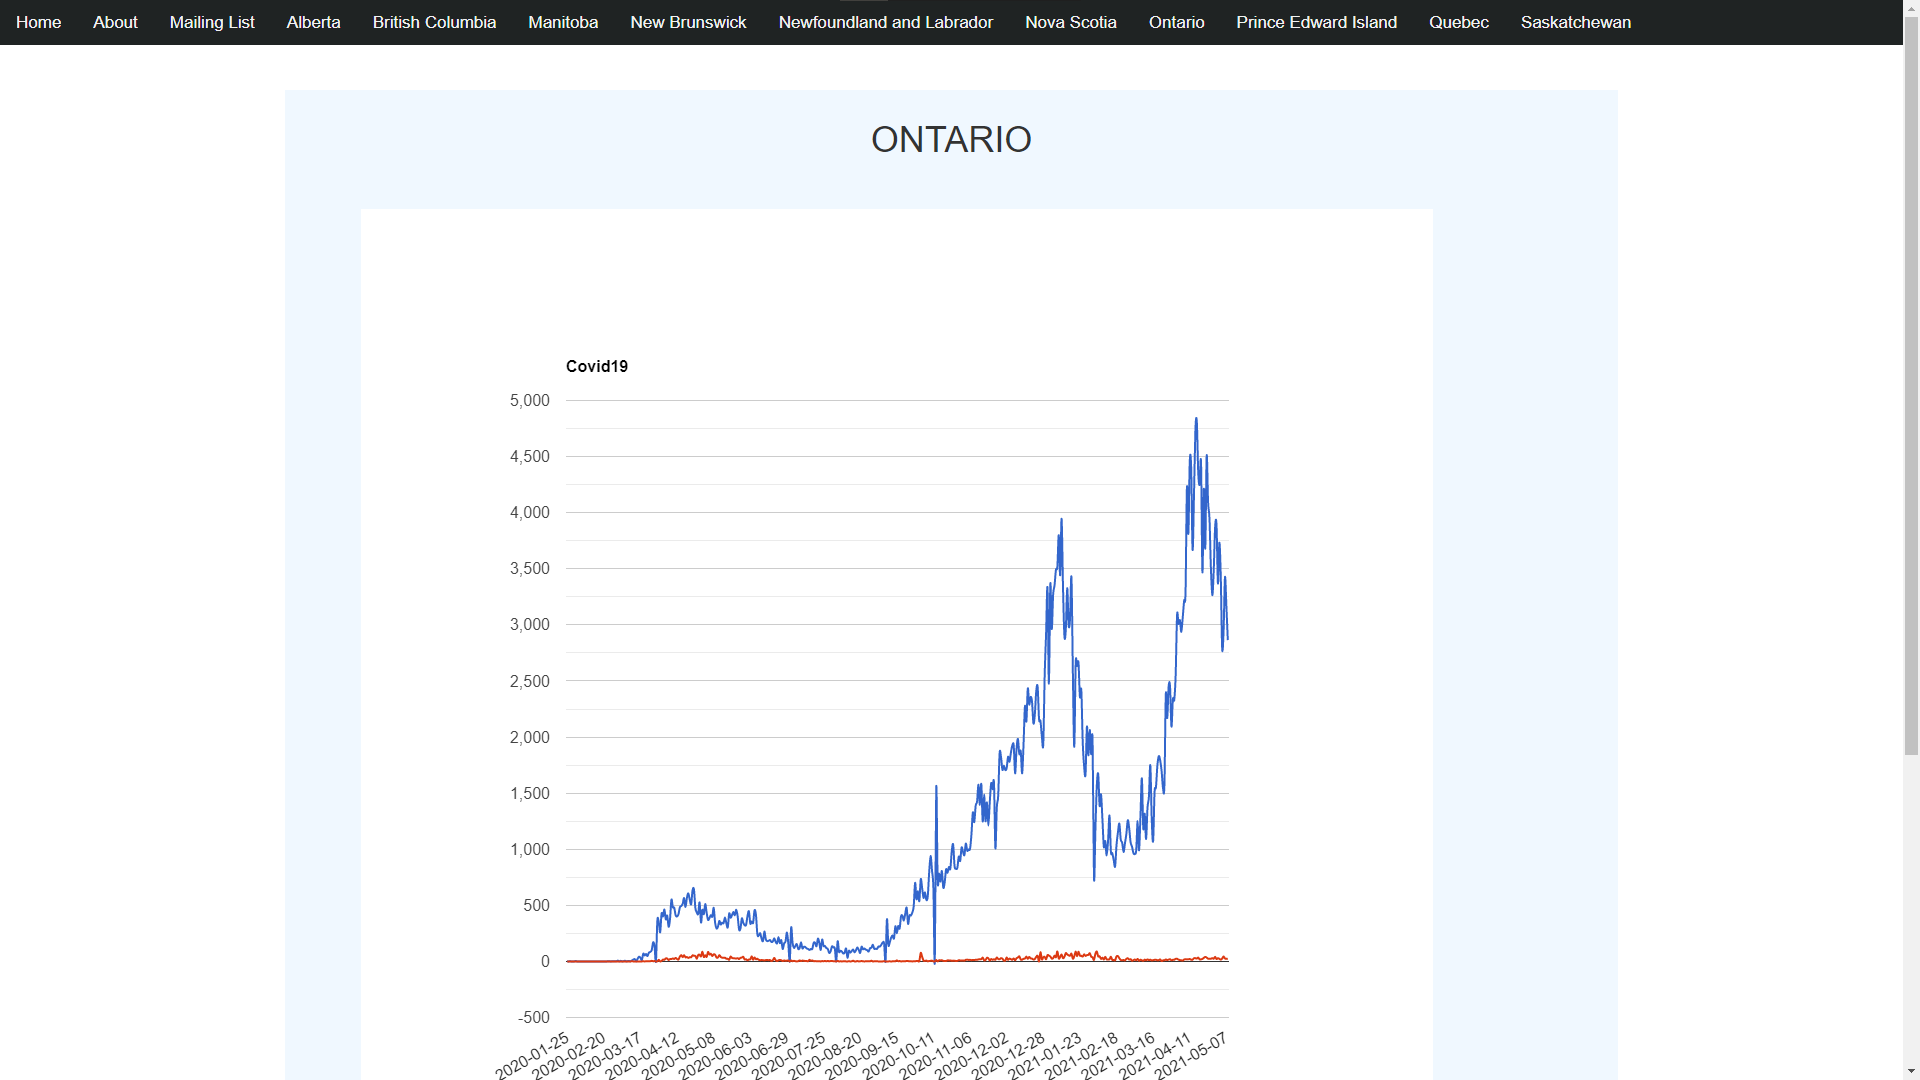
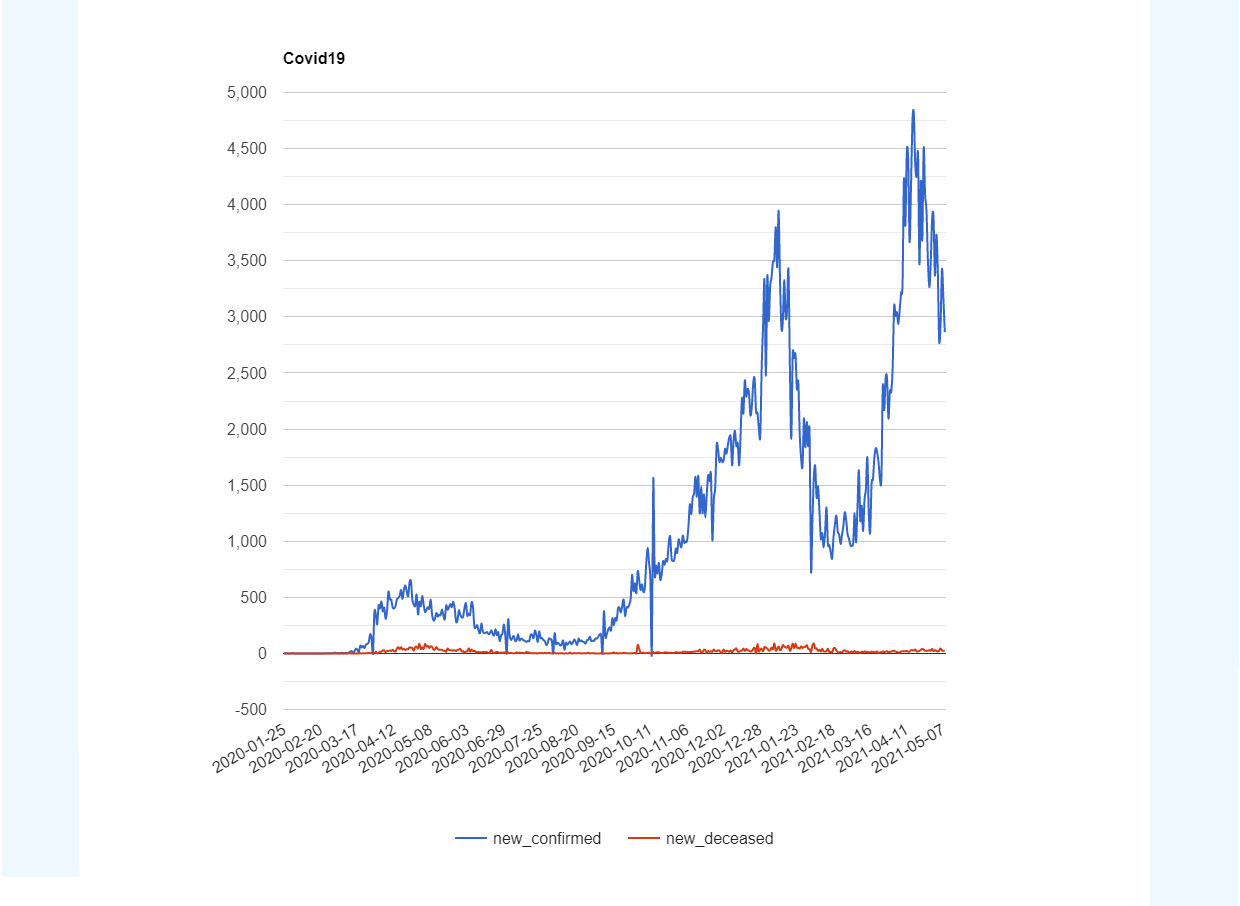
Ontario Historical Data
-
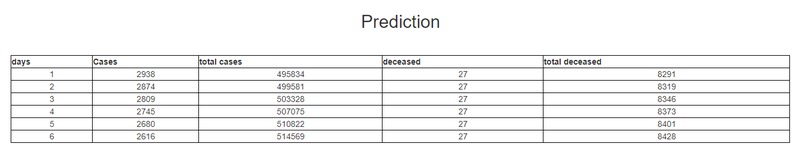
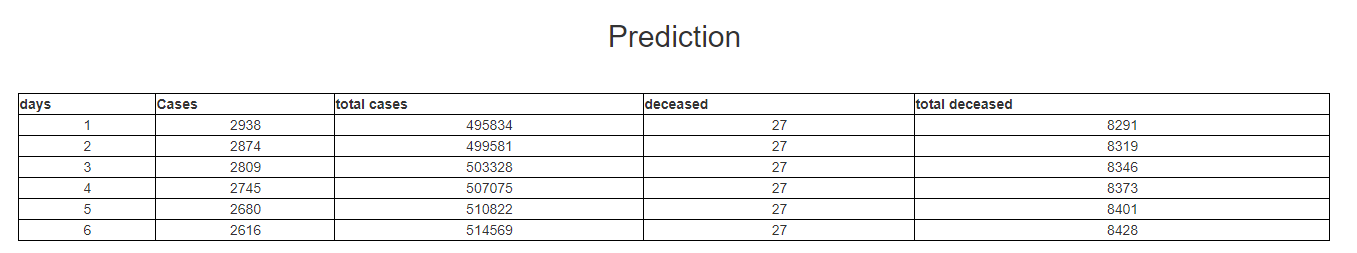
Ontario 5-day Prediction
-
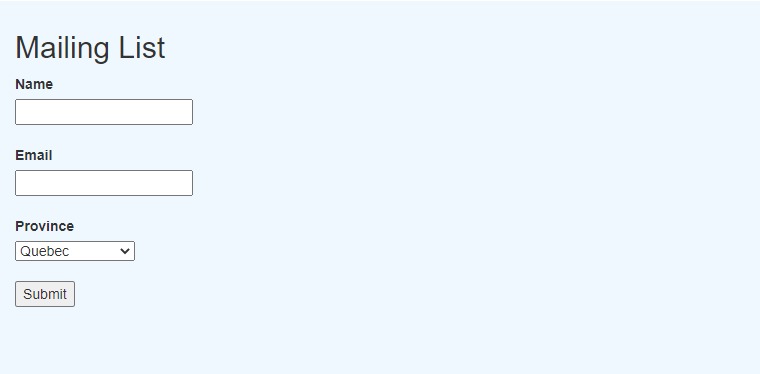
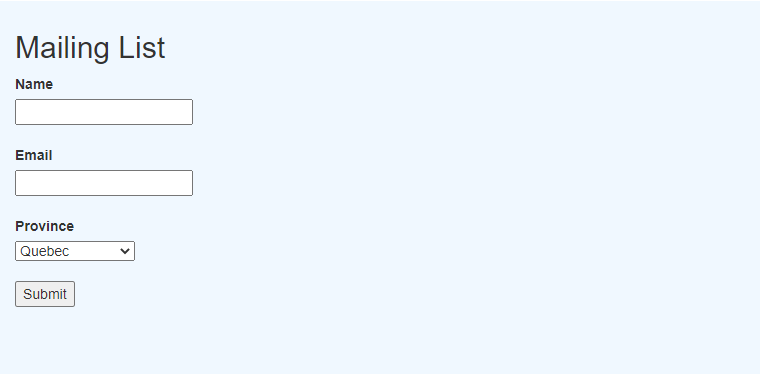
Mailing List Form
Inspiration
We were inspired by the effects that this pandemic had on everyone. We wanted to make an easy-to-use website that tracks cases for all provinces. We also really want this pandemic to end, so using this app to predict cases will help us understand the risks and allow us to go back to normal faster.
What it does
Our application has a very nice user interface and allows for easy access to covid data. It allows the user to look at the cases for each province in Canada and also allows us to see the predictions for the next 5 days of the cases and the people deceased.
How we built it
In order to build our app, we used python as our main framework. We also used Flask for the web framework. In order to get the data, we used Google cloud services. In order to display the data, HTML, CSS and Javascript were used. For the prediction algorithm, we used sklearn with the linear regression module.
Challenges we ran into
We wanted to use openAI for our prediction algorithm but we were not able to get the API key so we decided to go with Sklearn. Also, we had problems getting the data to display, we had to take the data in data frame format and pass it to the JSON format which was a big challenge.
Accomplishments that we're proud of
We were able to get the graph displaying directly from the google cloud data dynamically for the province of Quebec. So each day the graph will look different and this is done by querying the database every time the app is running. This is done in an efficient way and we are proud of it.
What we learned
We learned how to build a website and how to pass data from the backend to the frontend. This has been done using flask and we also learned about API. We also learned how to display live data in HTML using Javascript.
What's next for Covid19 prediction
We want to make the UI better and work on the prediction algorithm to make it more accurate and take into account different factors like vaccination rates.

Log in or sign up for Devpost to join the conversation.