-
-

My pic
-

Corona funny pic
-

Logo
-
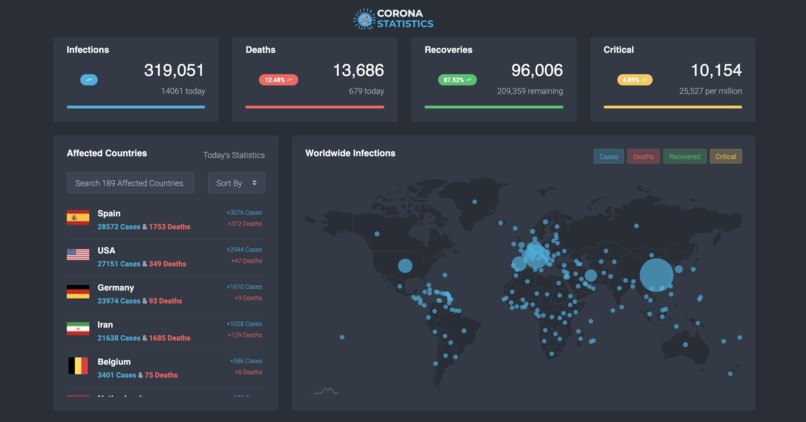
Screenshot of main screen
-
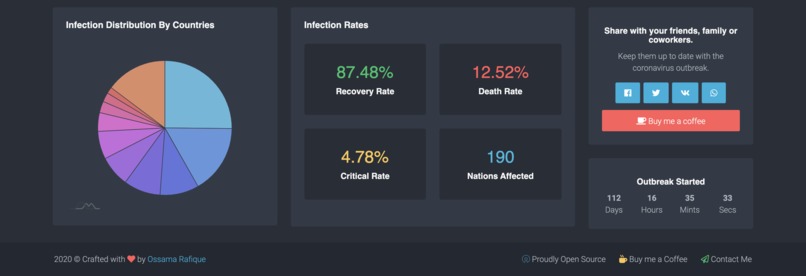
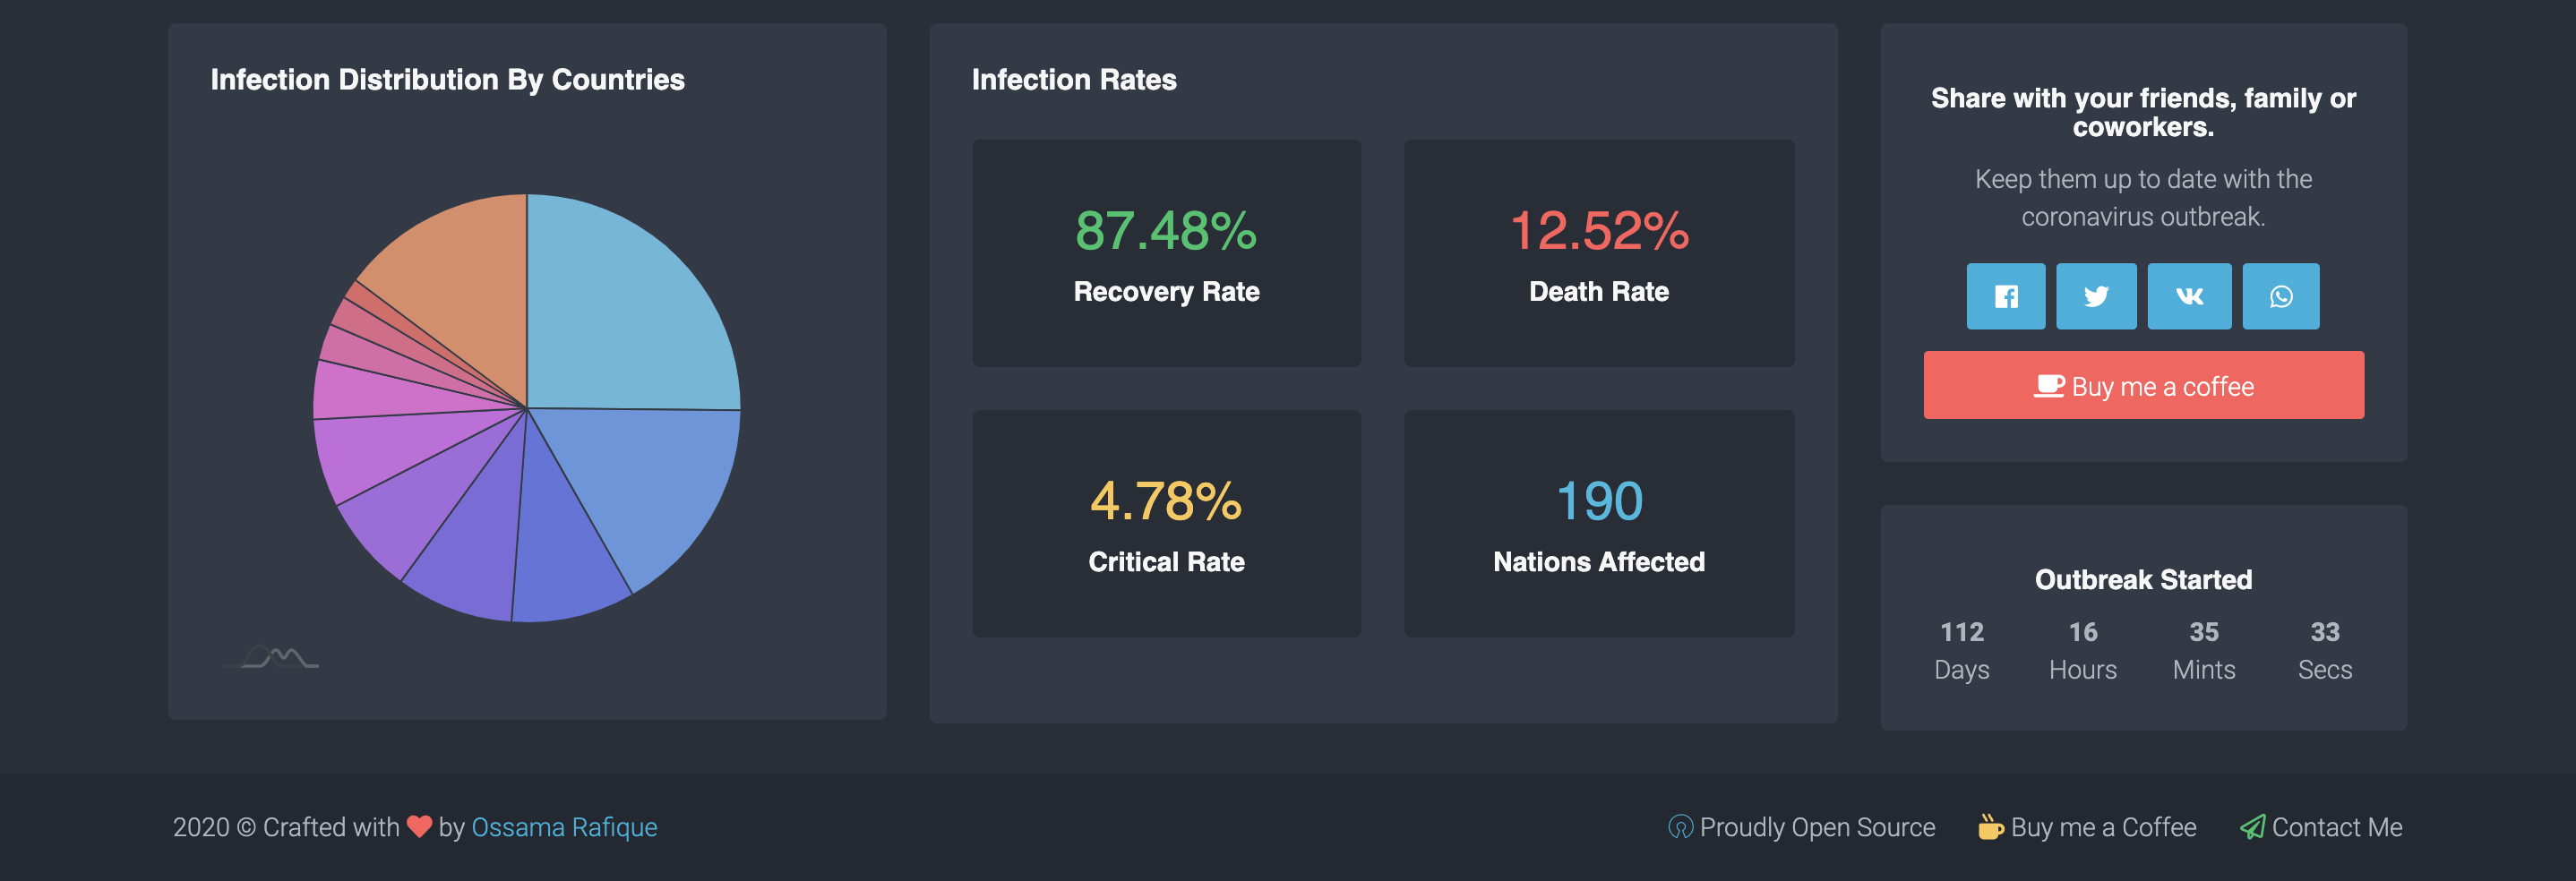
screenshot of analytics and statistics
COVID19- Live tracker
It tells you not only numbers but also its impact and statistics


Updates

Thanks for the people who liked it
Leave feedback in the comments!
Log in or sign up for Devpost to join the conversation.
Log in or sign up for Devpost to join the conversation.