I wanted to understand how the pandemy was going in my country. Protezione Civile release every day at 18.30 new datas about the day.
What it does
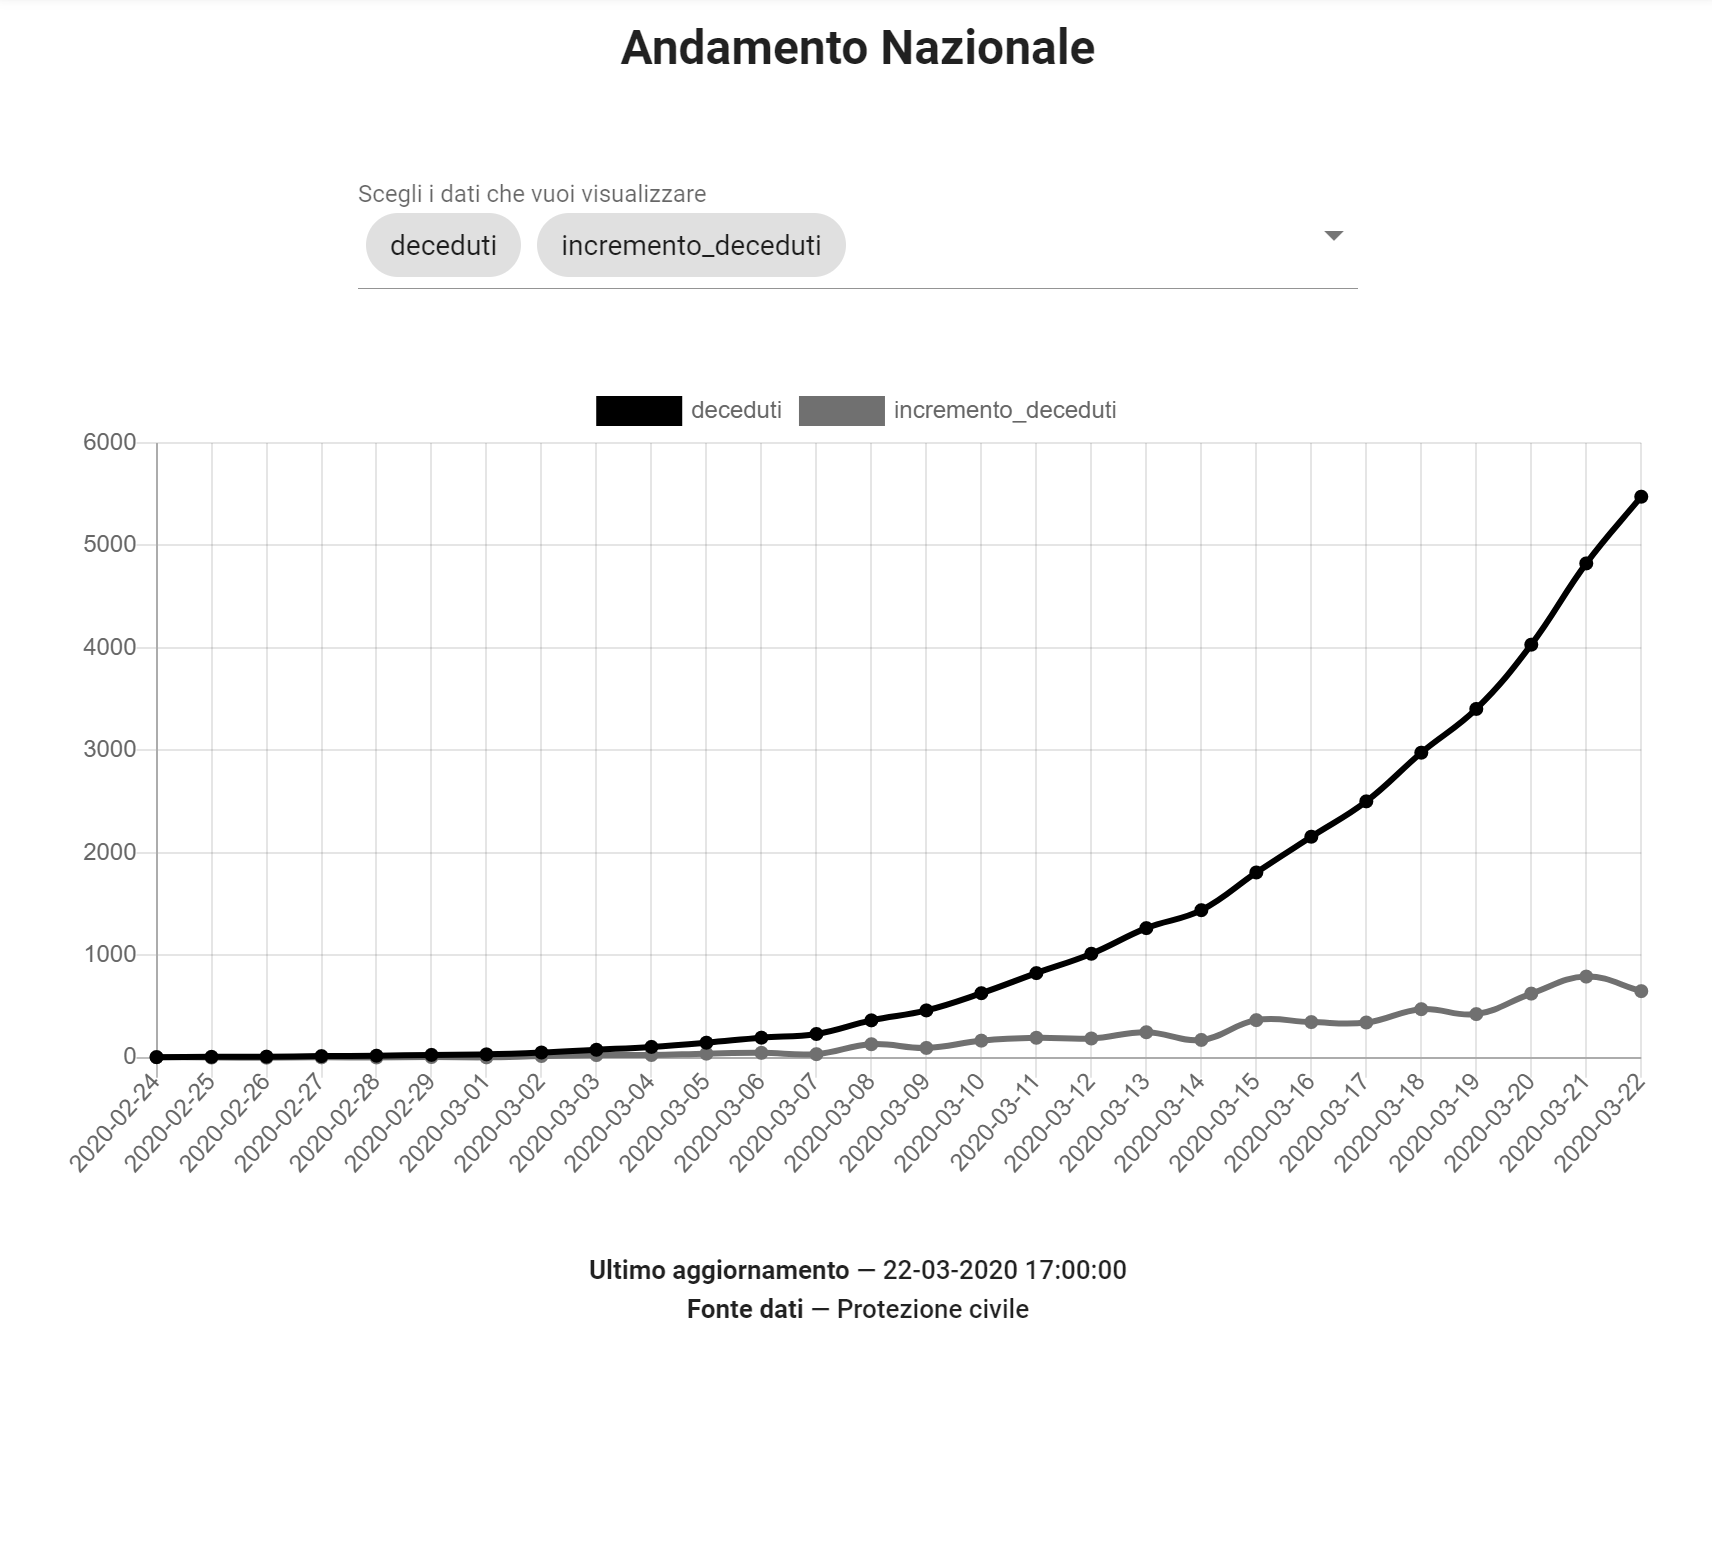
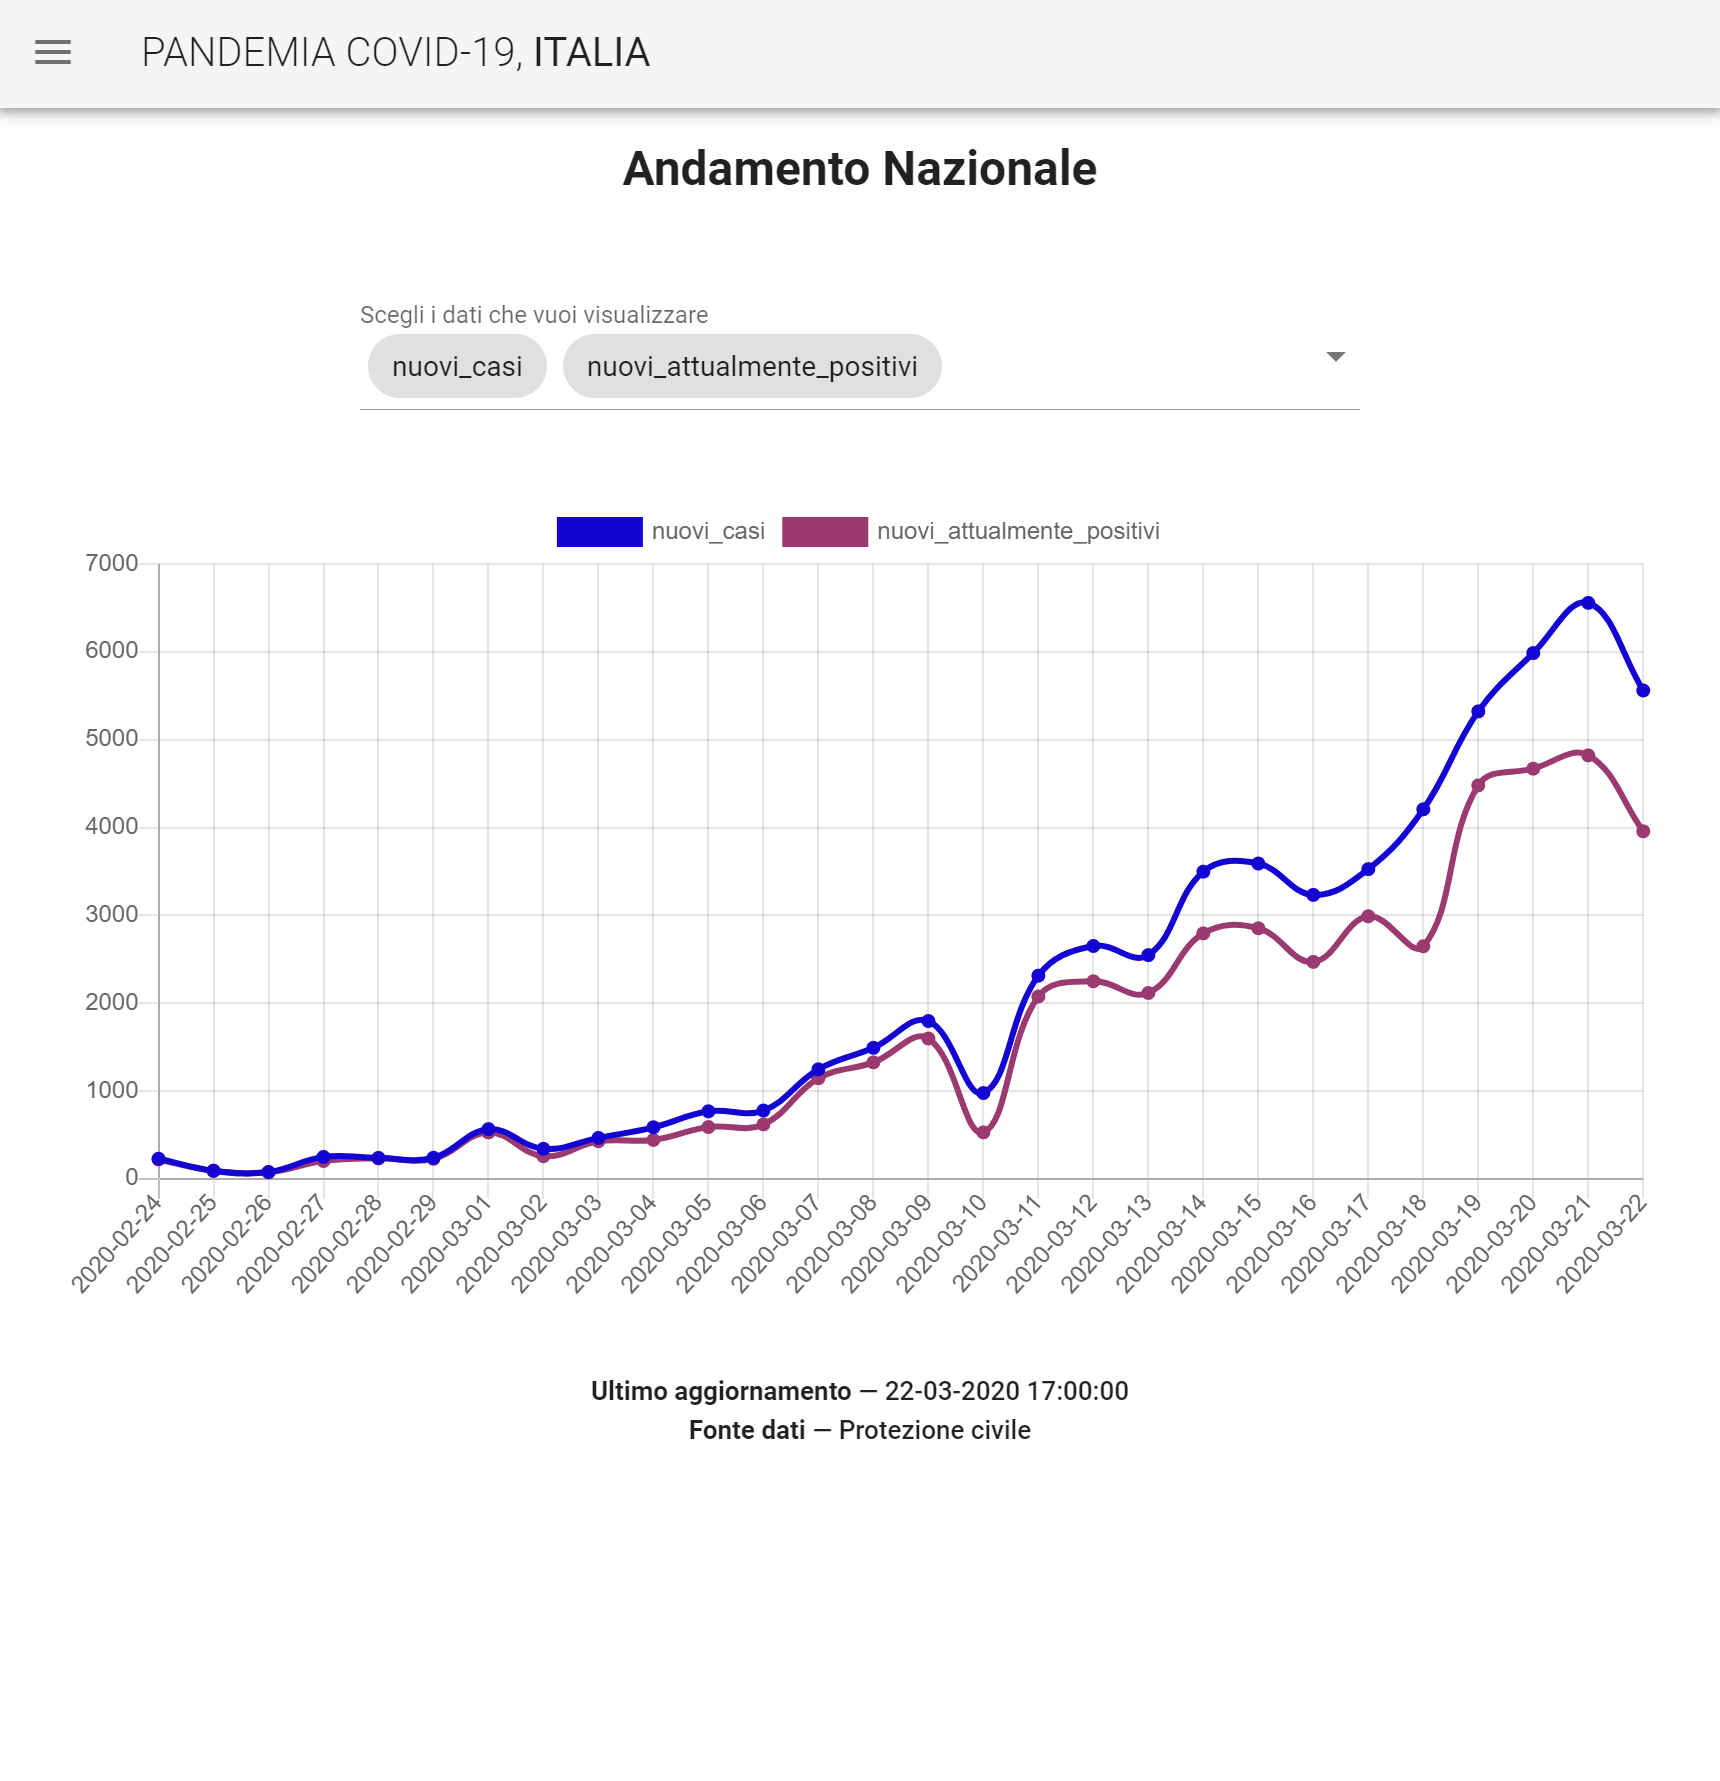
You can plot charts (national and regional)
How I built it
MongoDB + NodeJS api with Express and Mongoose, FrontEnd Vue+Vuex+Vue-Router
Built With
- node.js
- vue
- vuex

Log in or sign up for Devpost to join the conversation.