Inspiration
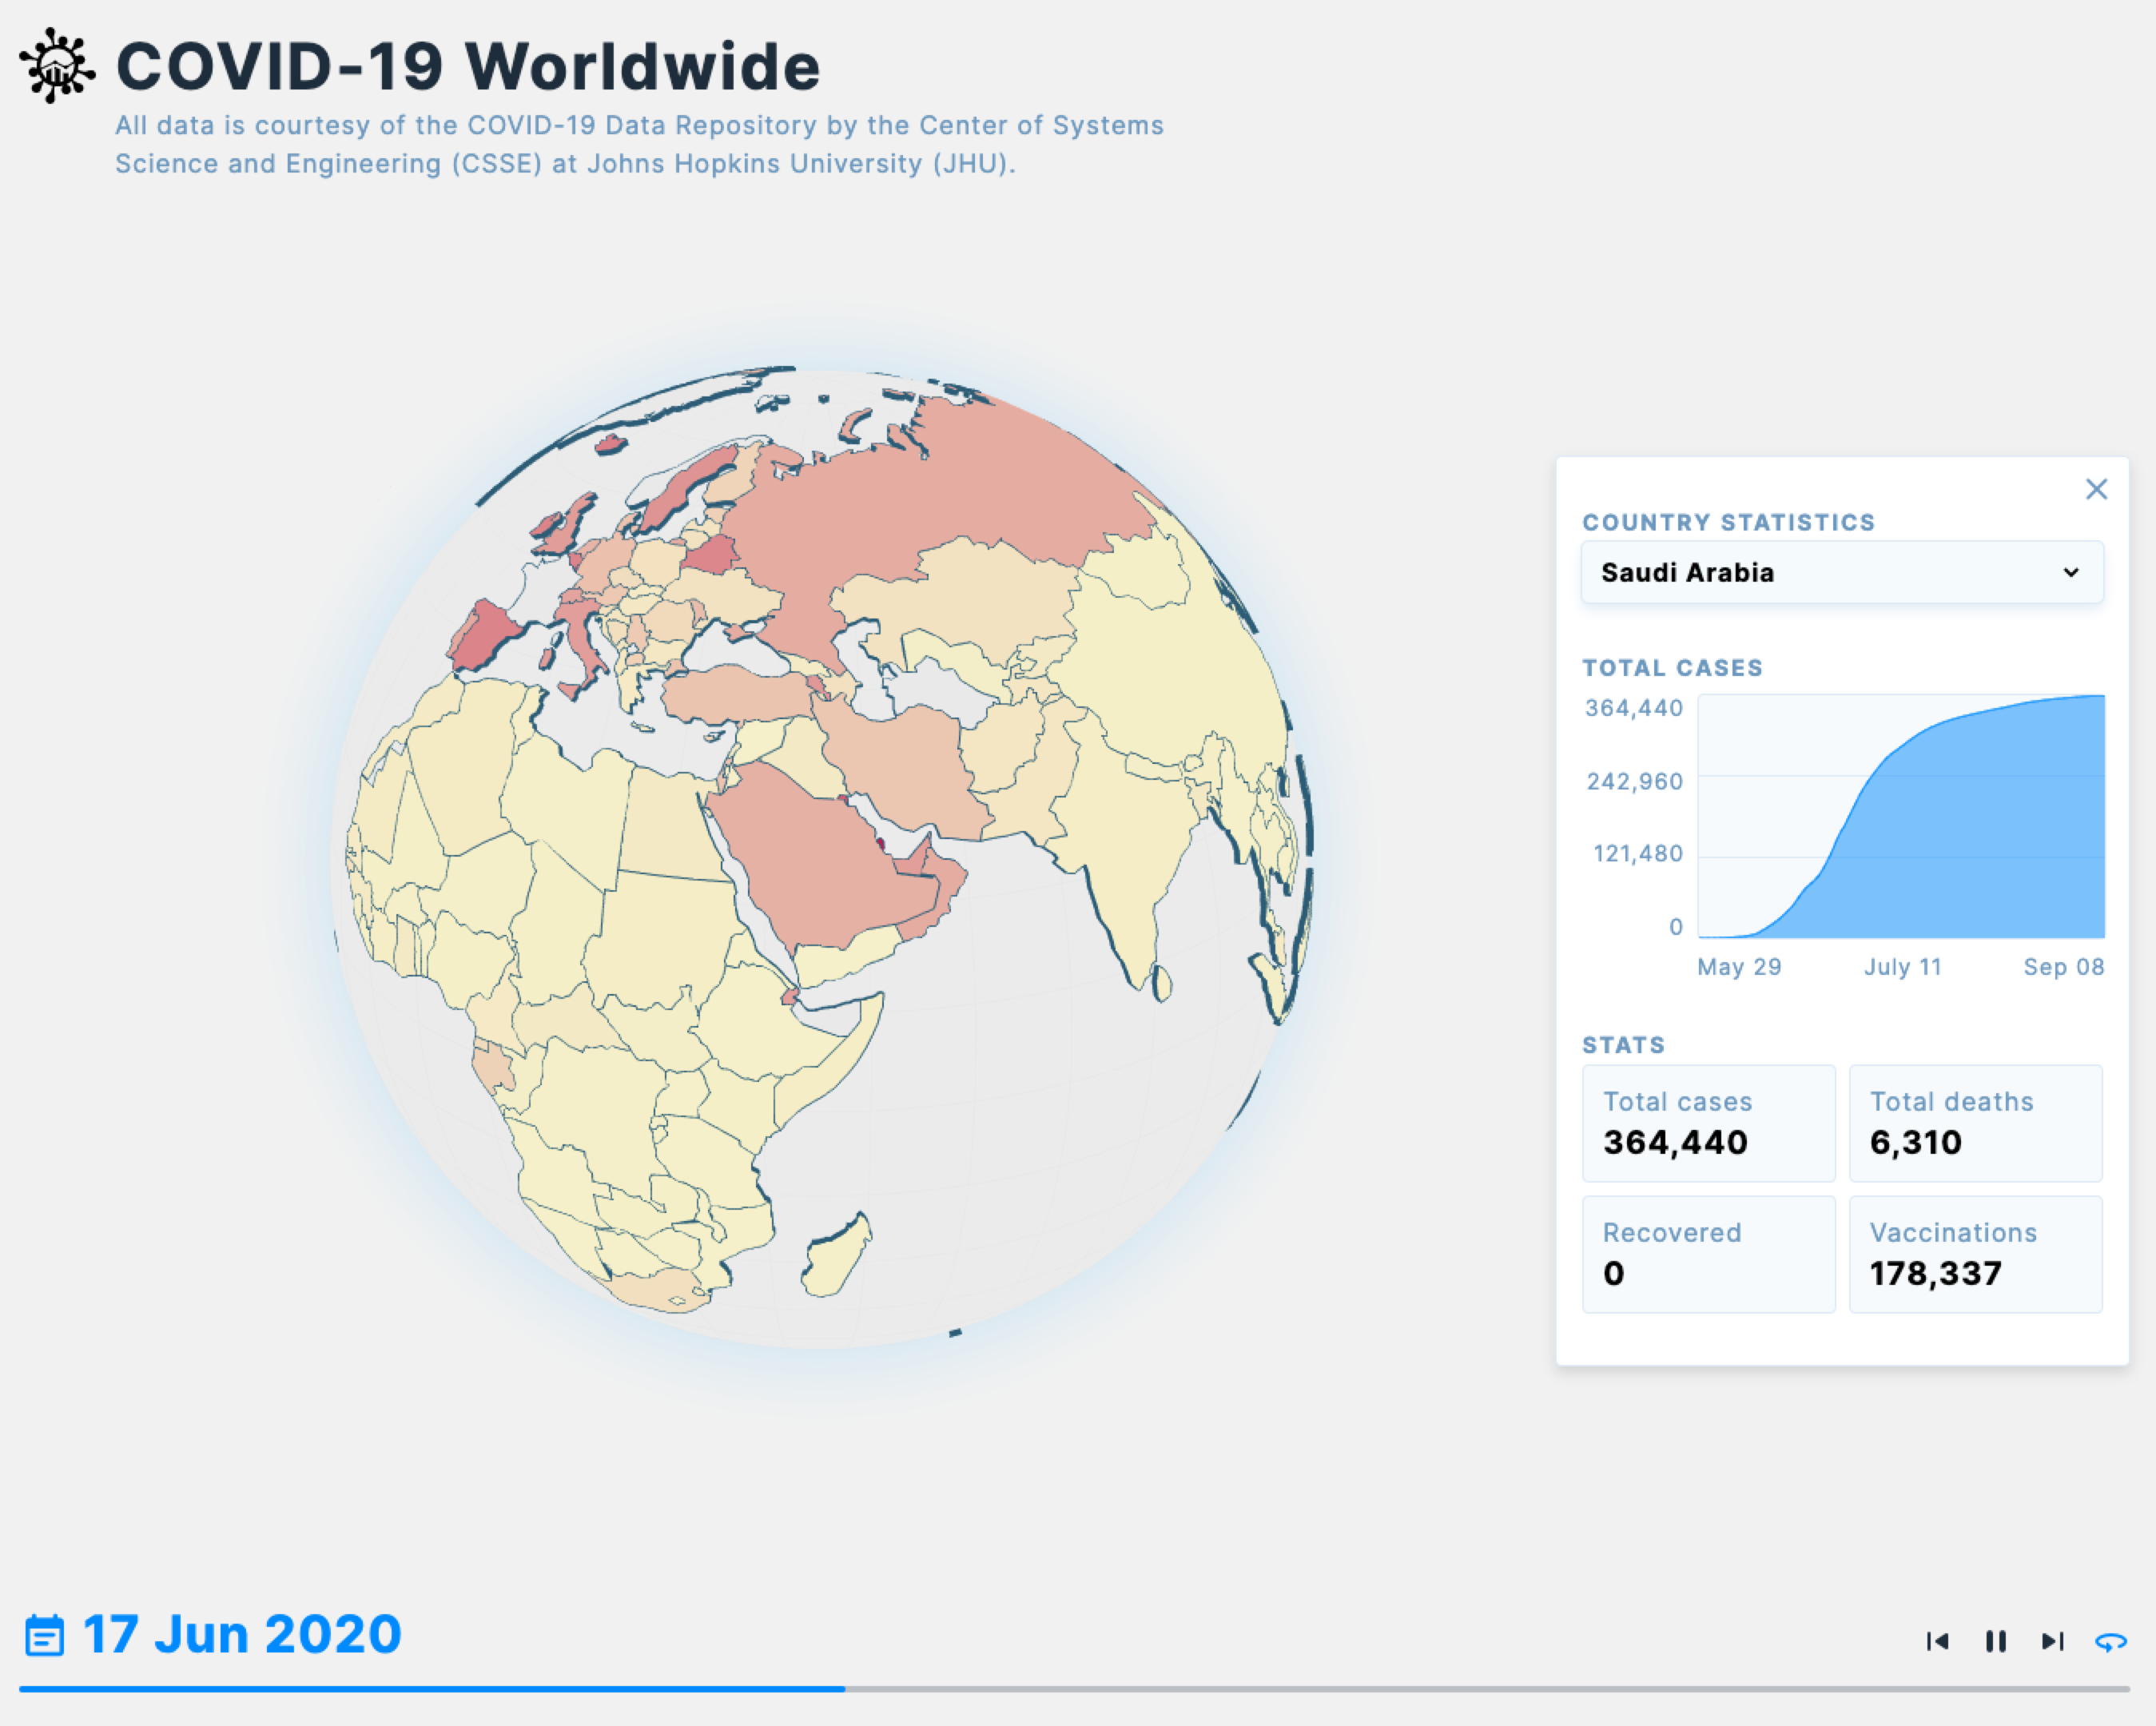
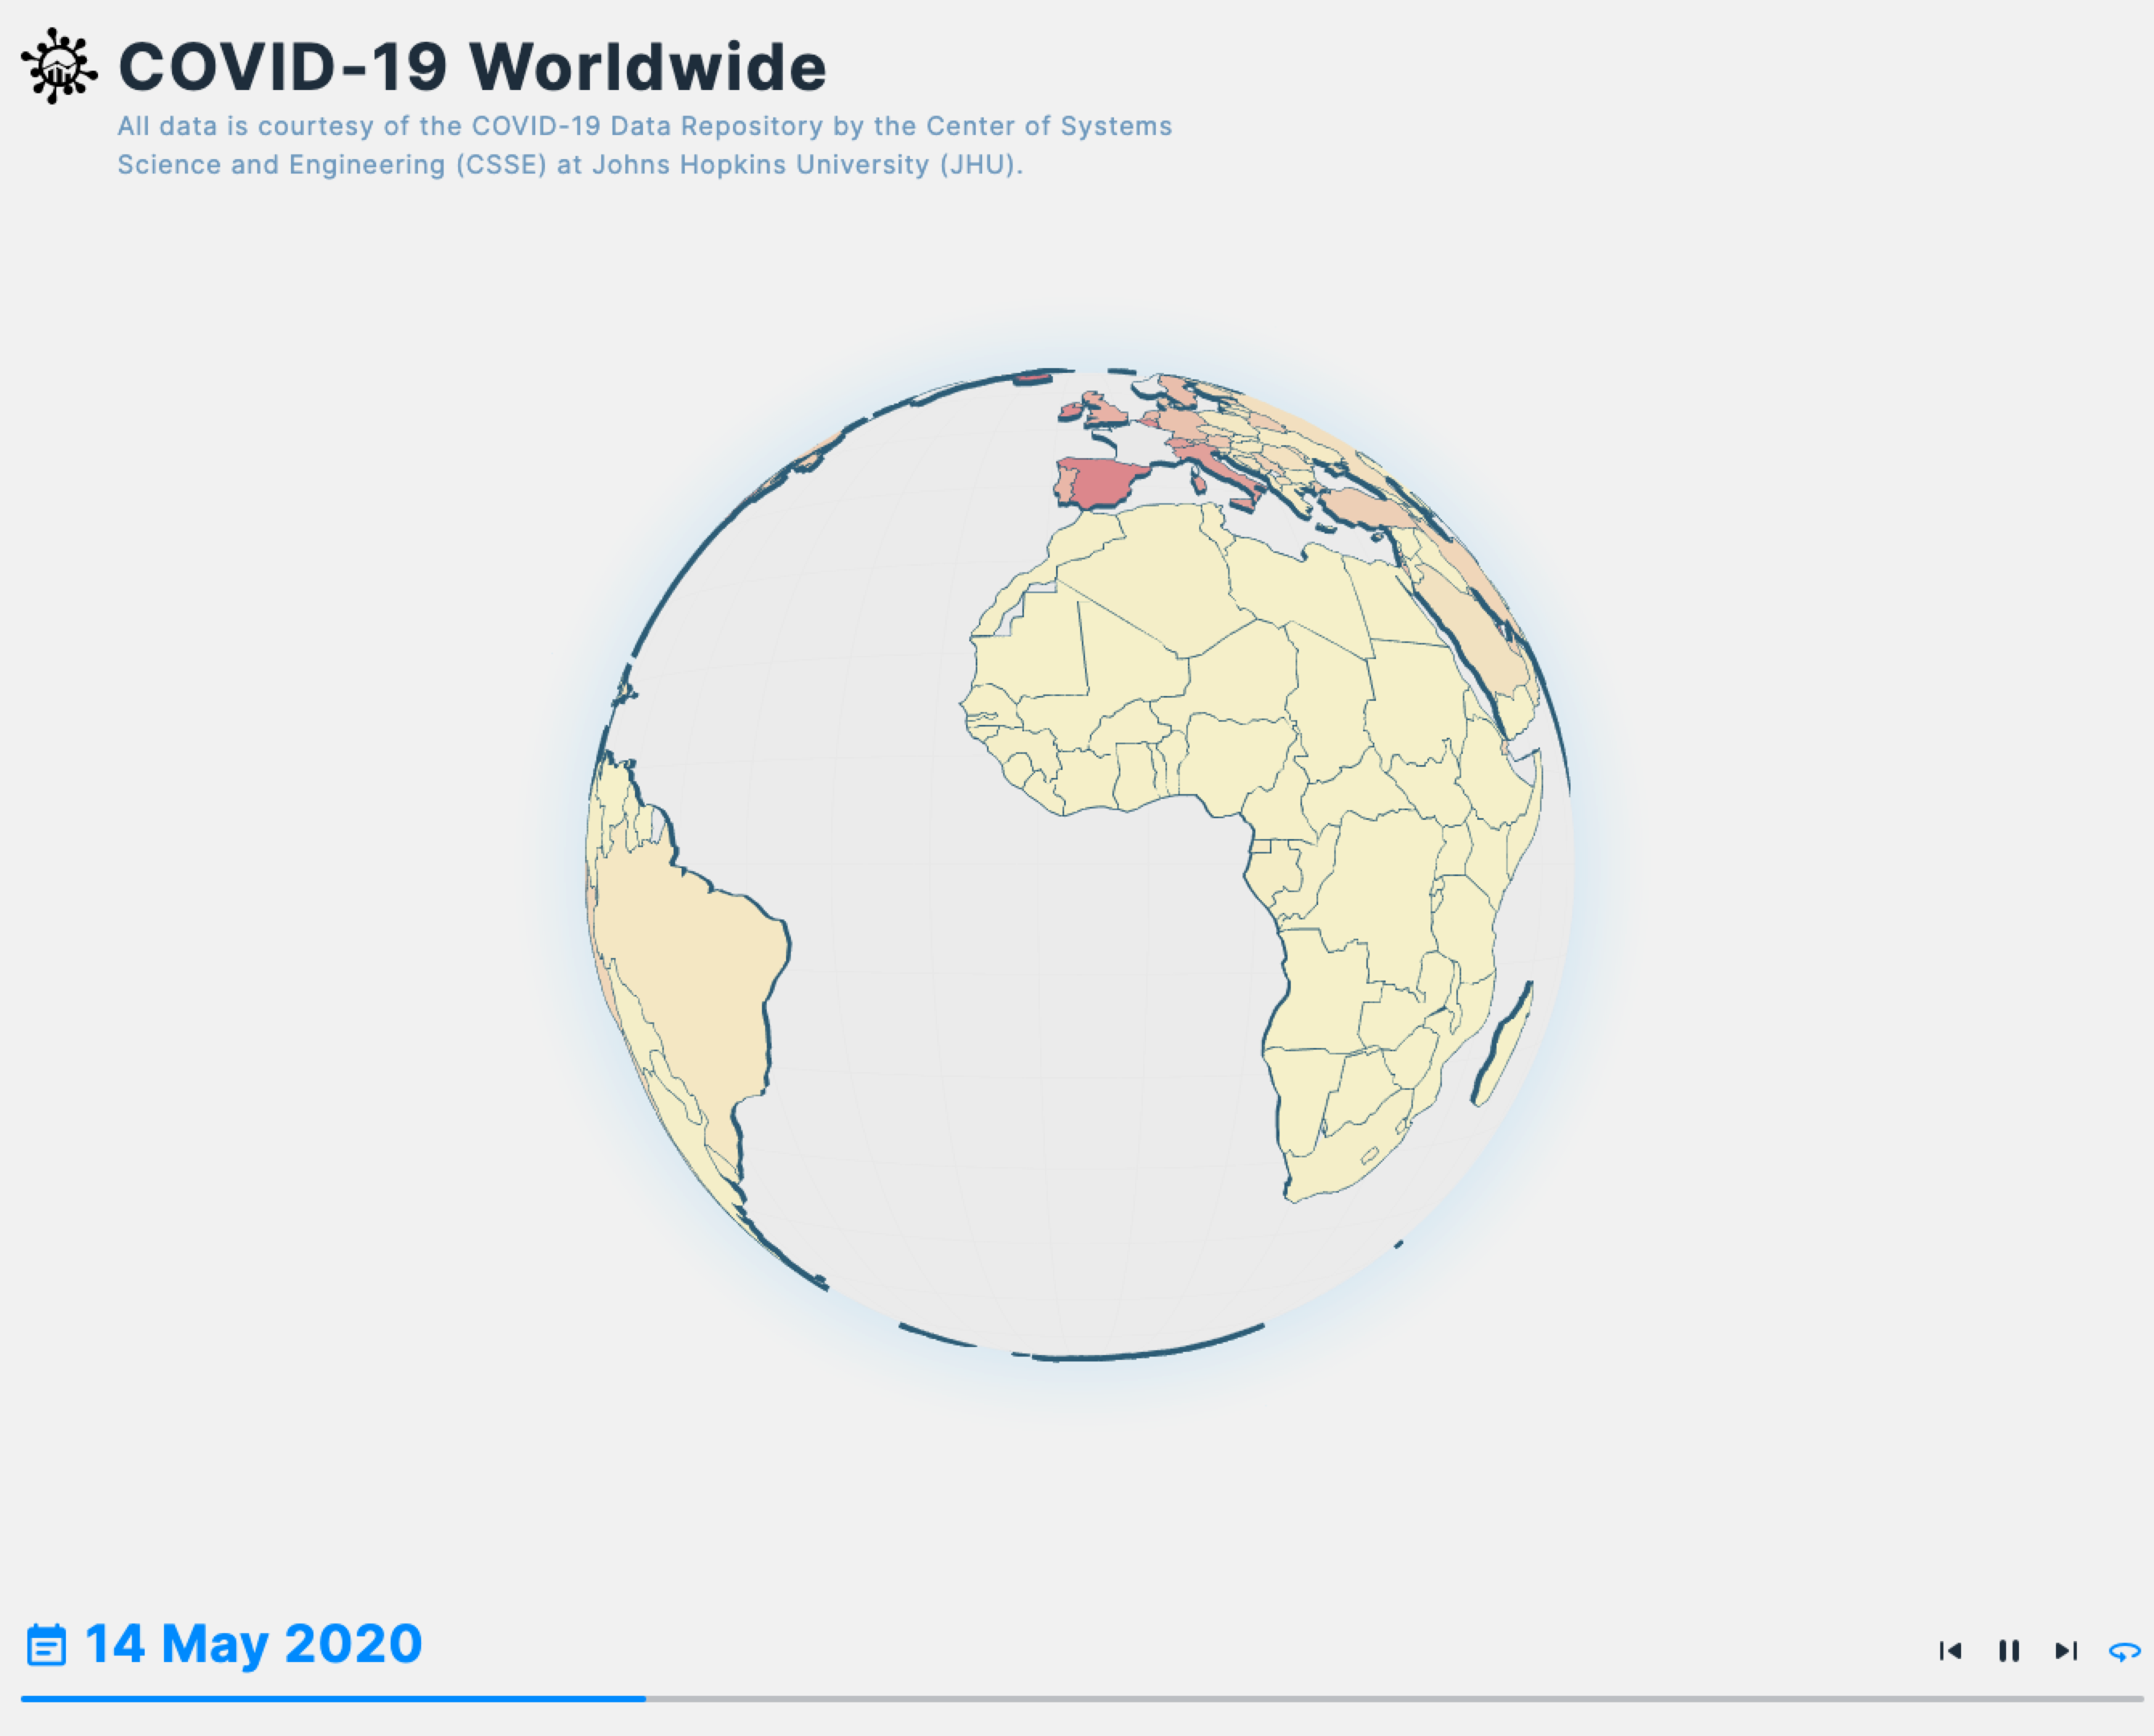
COVID-19 is something that has affected all of us, each in varying amounts. Even with a vaccine being developed the threat of COVID-19 still looms large over many countries. A large contributor to the spread of the disease is underestimation of risk. We created an interactive 3D visualization of the spread of COVID-19 across the world to provide a strong visual source of how serious the impact of COVID-19 is.
What it does
Displays the geographical history of COVID-19 on an interactive globe from your web browser. Automatically shows the hotspots in COVID-19 activity around the world over time. Also provides data about the number of vaccinations handed out per country.
How we built it
React, Three.js, Node.js, MongoDB, Heroku
Challenges we ran into
Retrieving, storing, and displaying the data Finding reliable sources of COVID-19-related information
Accomplishments that we're proud of
What we learned
Prioritization 3D rendering and interactivity Database normalization and queries
What's next for COVID-19 Worldwide
Retrieving new data automatically Other categories for data visualization UI improvements


Log in or sign up for Devpost to join the conversation.