Inspiration
When the whole world was shut inside, we realized how Machine Learning could be put into use to help us cope with the situation. We tried to incorporate different types of data formats to help us understand the situation we are in
What it does
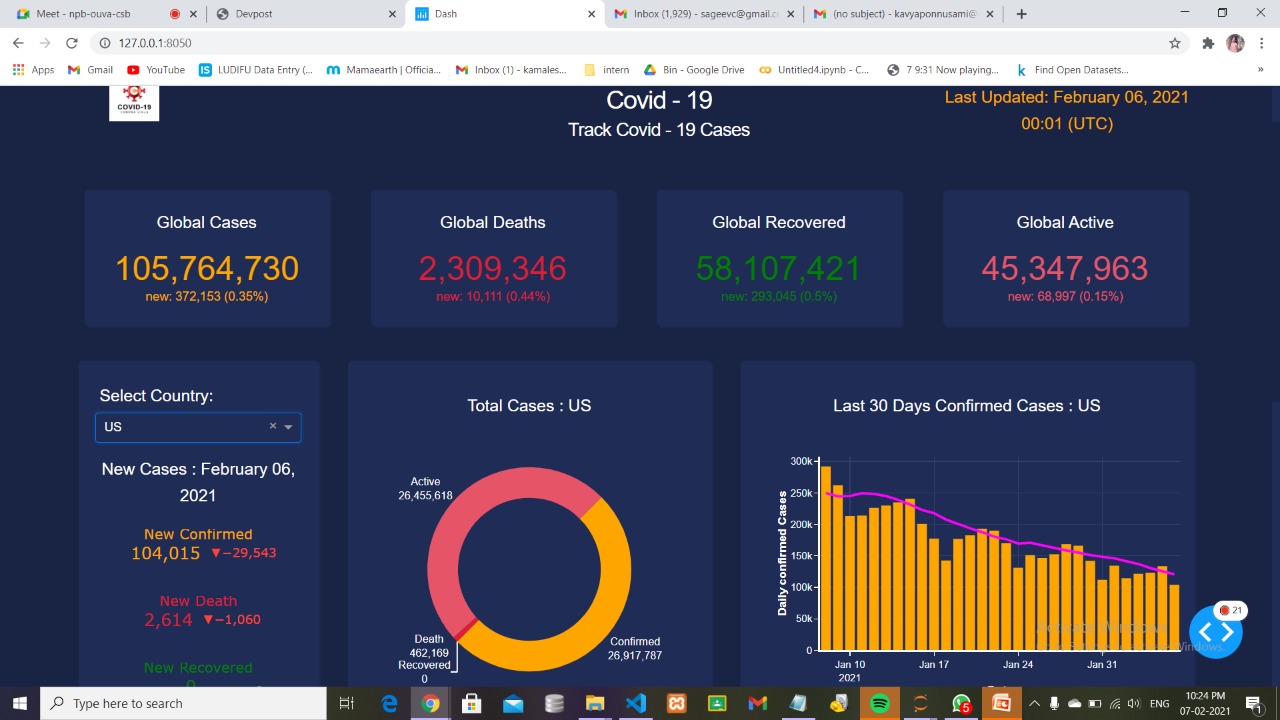
- We developed a dashboard to visualize the spread of COVID19 all around the world.
- An application to help us if people are wearing the facemasks
- A sentiment analysis application to understand the mentality of people during the pandemic.
How we built it
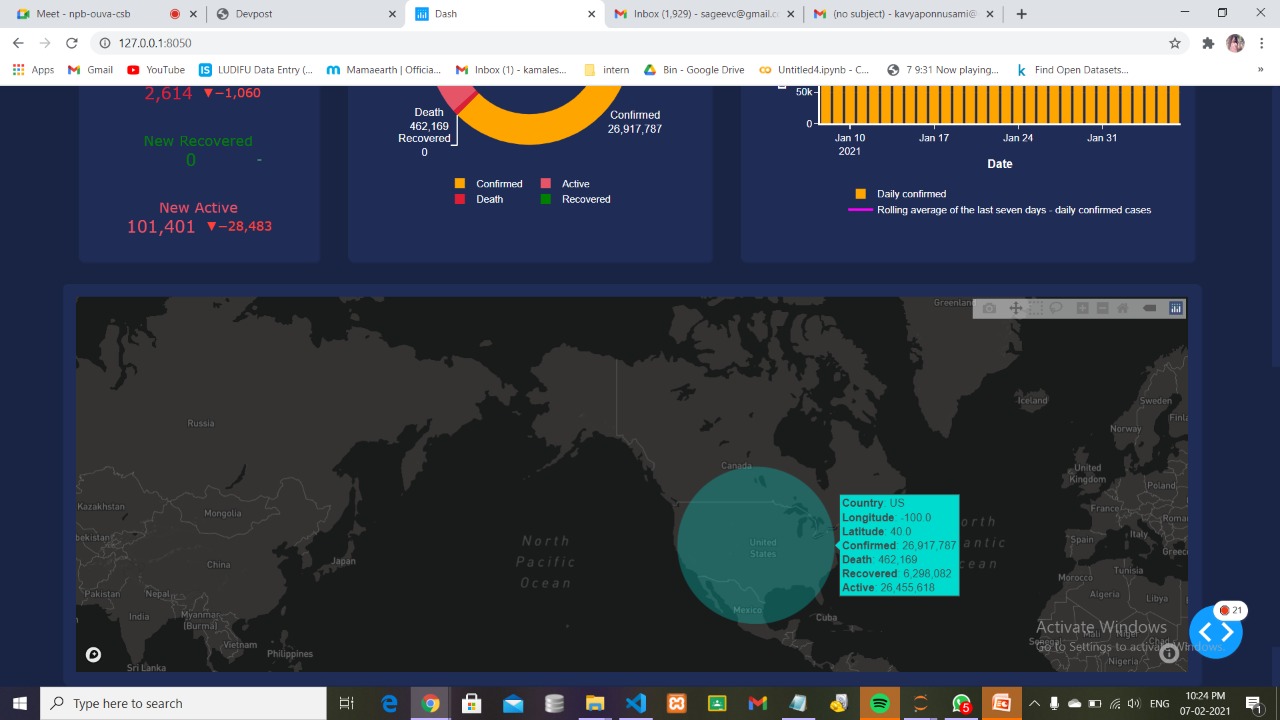
We started the project with developing the dashboard using Python. We used Flask to depict the dashboard as an application. This dashboard is created in python using Plotly dash library. There are cards in this dash web app. Cards display global cases and data is updated on the cards once in a day. Plotly indicators display new cases values for each country and any country is selected from the dash core component drop down list. Plotly donut chart displays total values for each country in this dash web app. Plotly combination of line and bar chart displays last thirty days daily confirmed values and rolling average of the last seven days for daily confirmed cases. Plotly scattermapbox chart displays total values for all countries in this dash web dashboard.
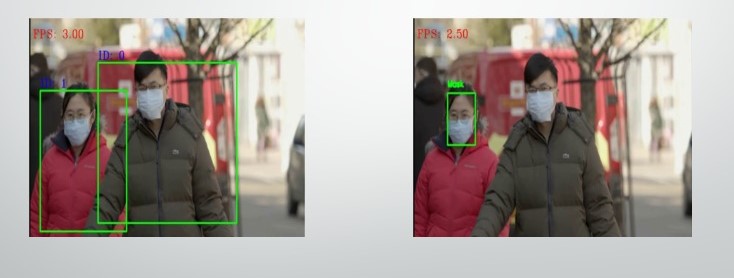
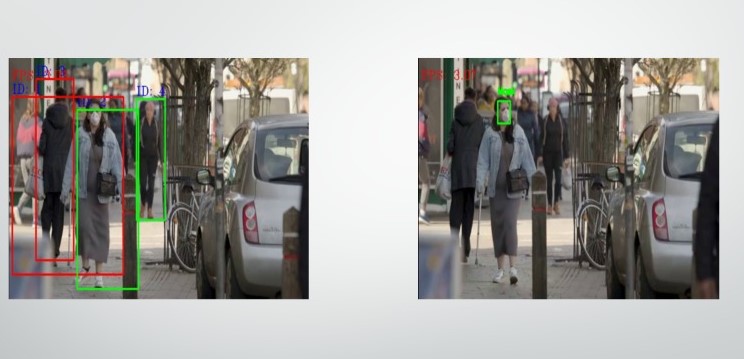
To create safe environment that contributes to public safety, we propose an efficient computer vision based approach focused on the real-time automated monitoring of people to detect both safe social distancing and face masks in public places by implementing the model on opencv and tensorflow to monitor activity and detect violations through camera. After detection of breach, it sends alert signal and notify us.
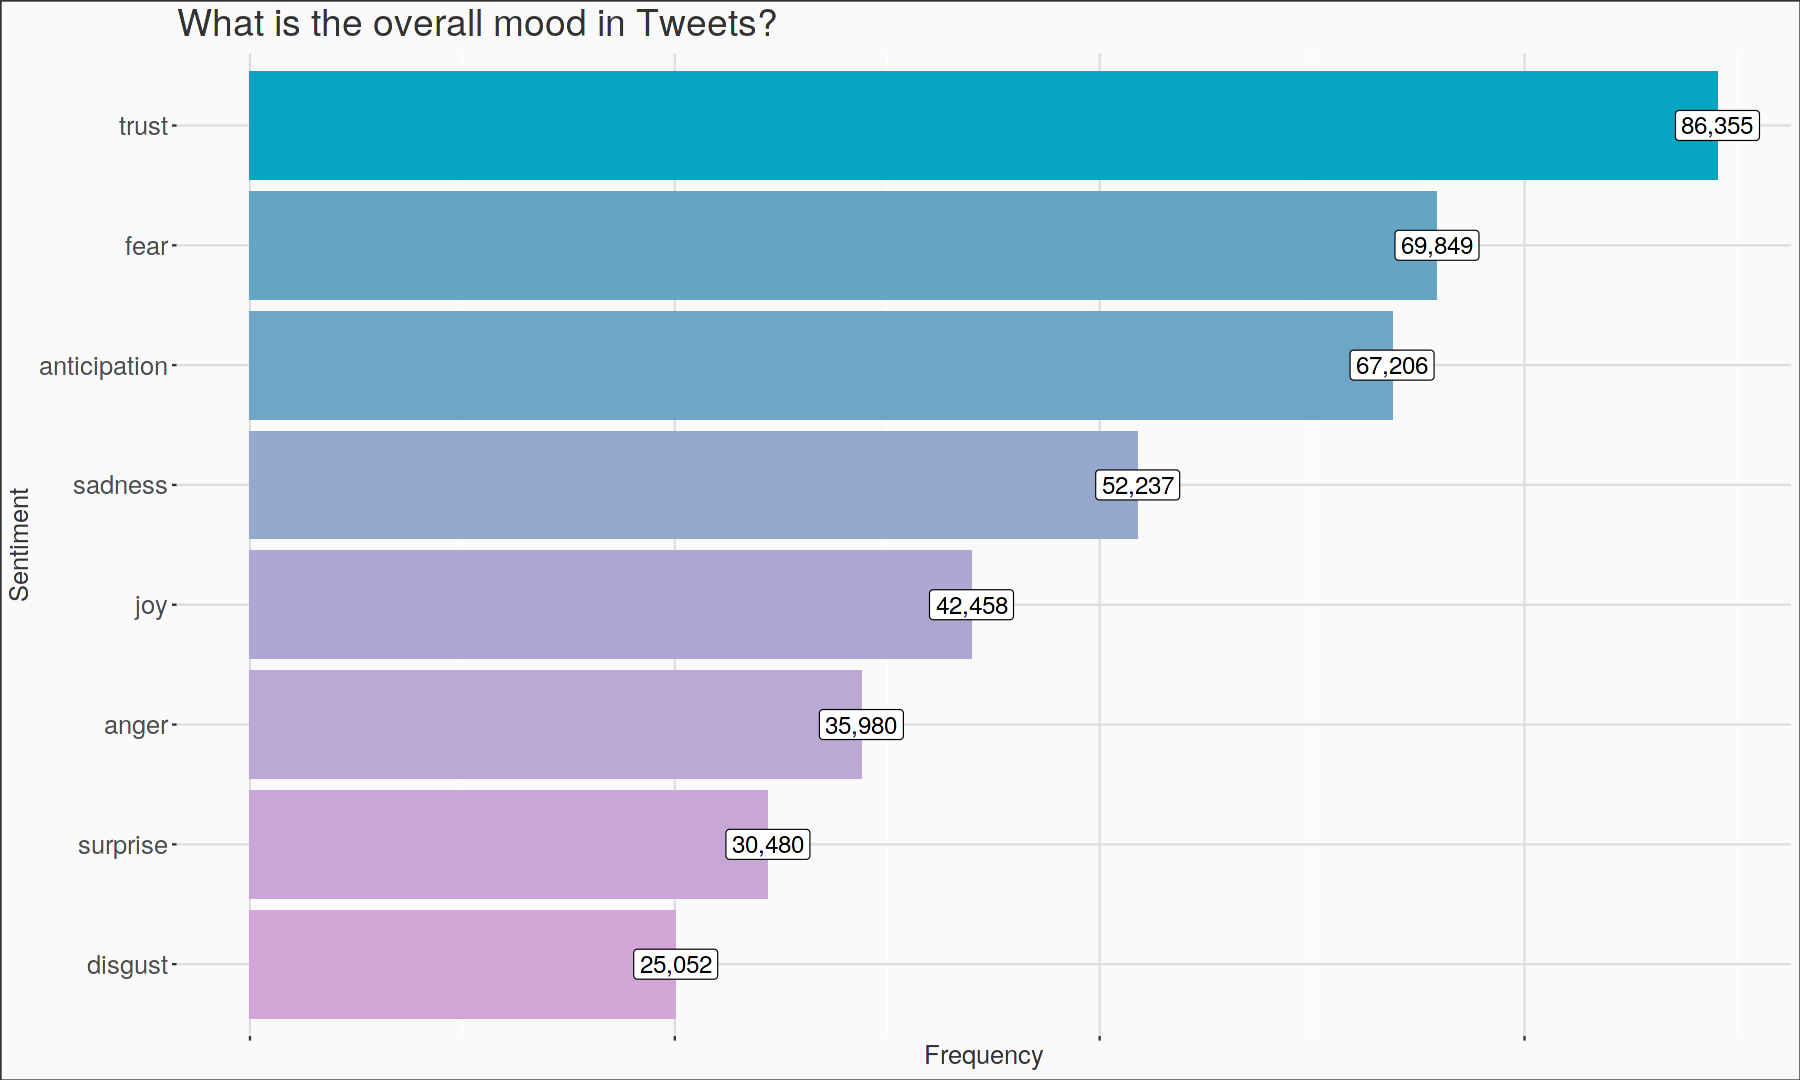
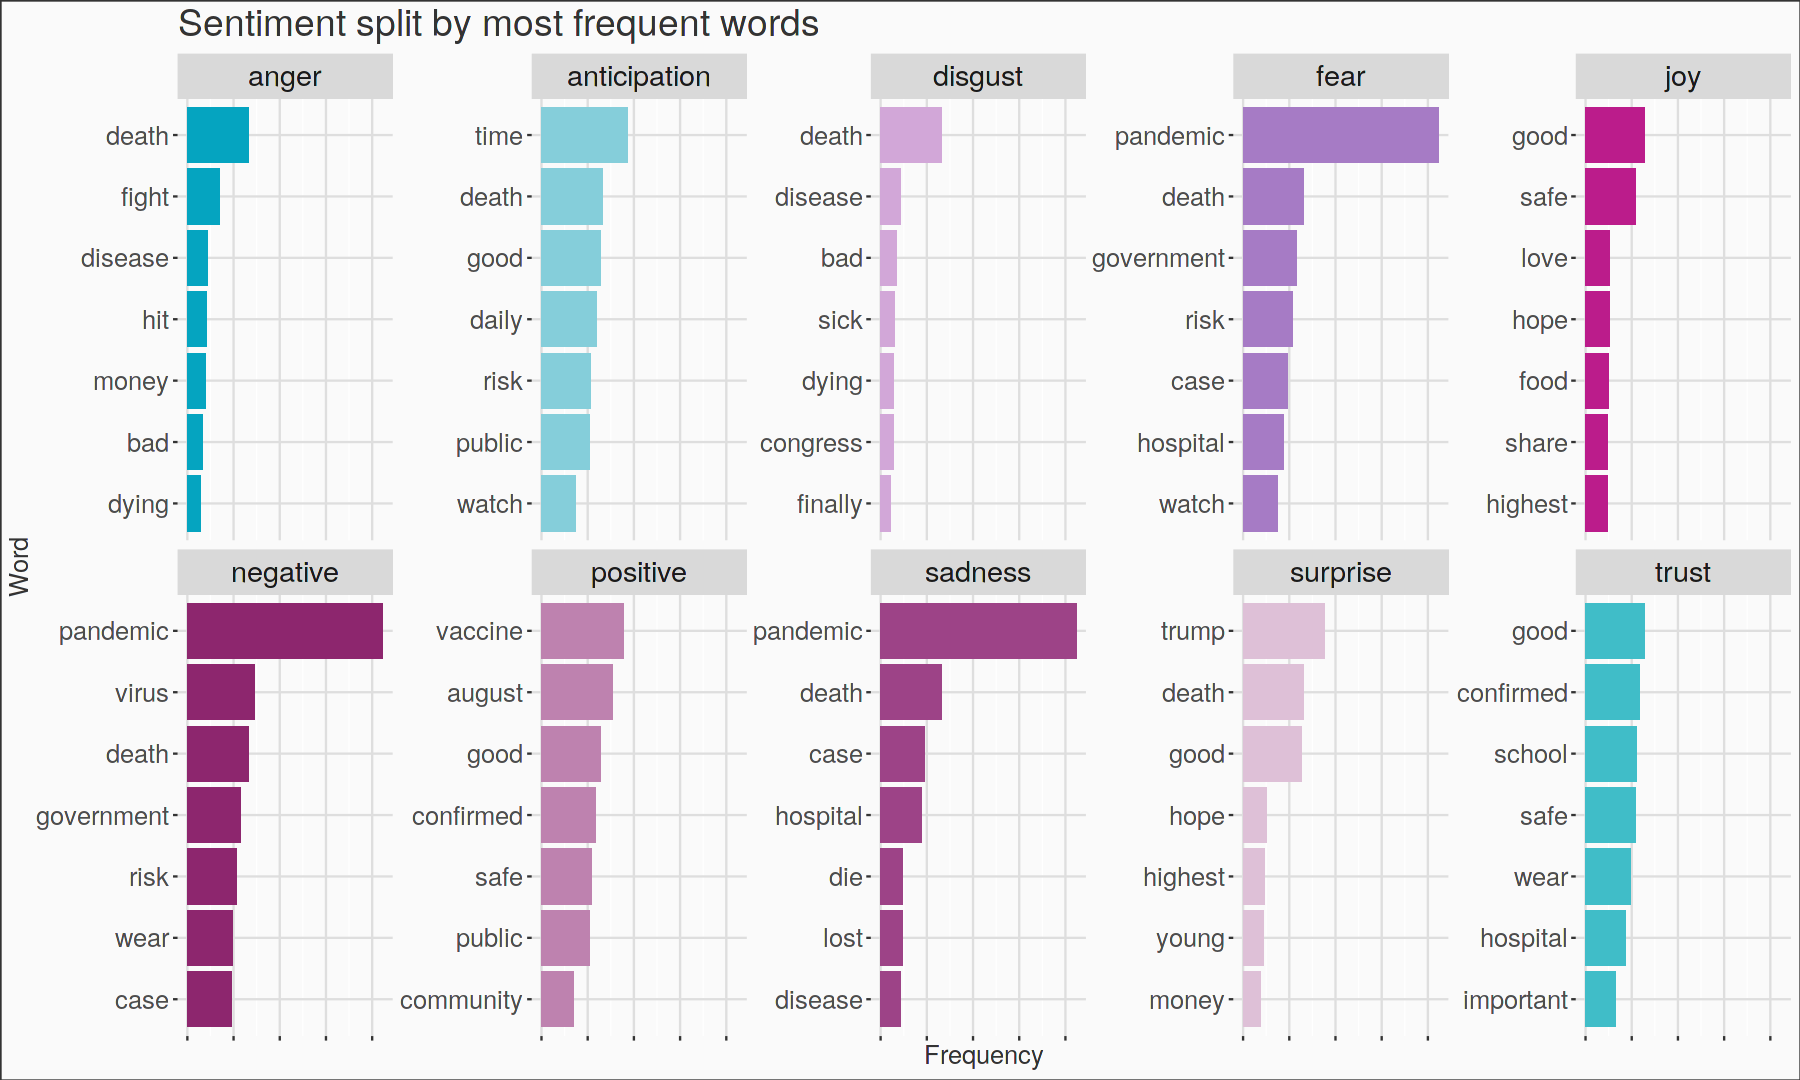
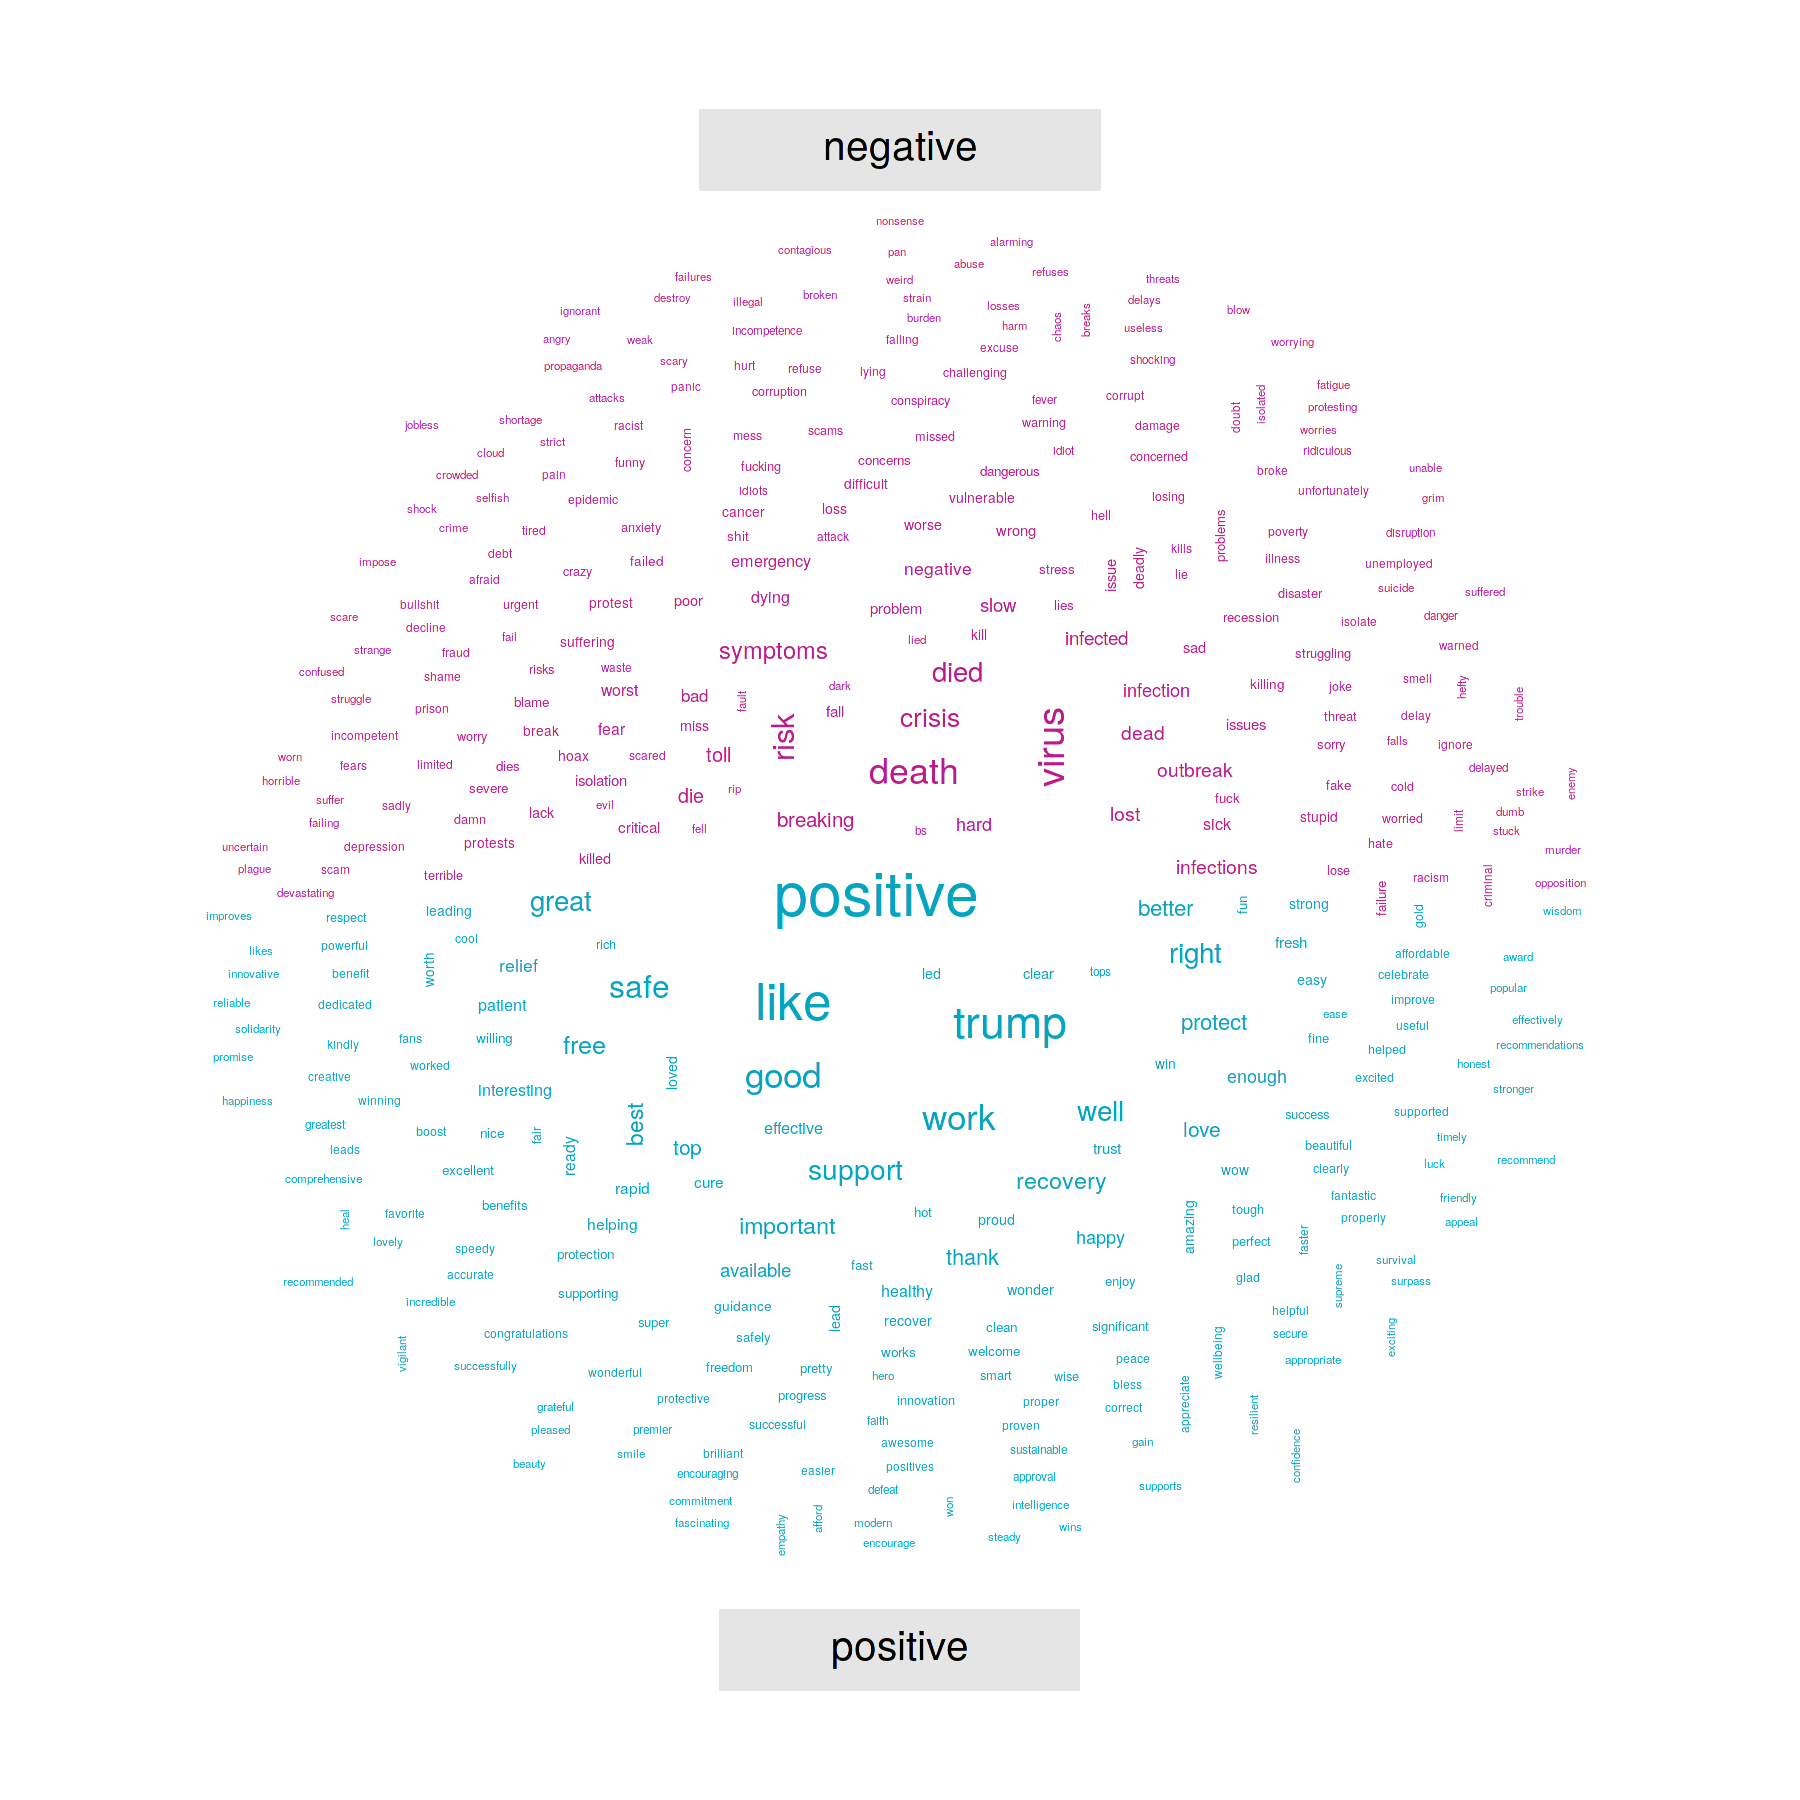
We used COVID Tweets dataset and perform sentiment analysis to classify the tweets as positive or negative using EDA and polarity to help us understand the mindset the user was in while tweeting.
Challenges we ran into
Incorporating different data formats and finding the accurate insights, integrating all three different models into a single application was quite challenging
Accomplishments that we're proud of
We are happy that we could pull off a good looking dashboard
What we learned
We learnt the importance of data and the insights it could provide when analysed properly
What's next for COVID19 - 360
Combing the three applications into one.

Log in or sign up for Devpost to join the conversation.