Inspiration
The main motive is to find the top most infectious resources for this case. It is known that COVID 19 can be spread from one person to another person directly. Also it is known that the person infected by that virus will not be aware of it for one week. So he/she may transmit that virus through any medium. So this issue made me to do this project.
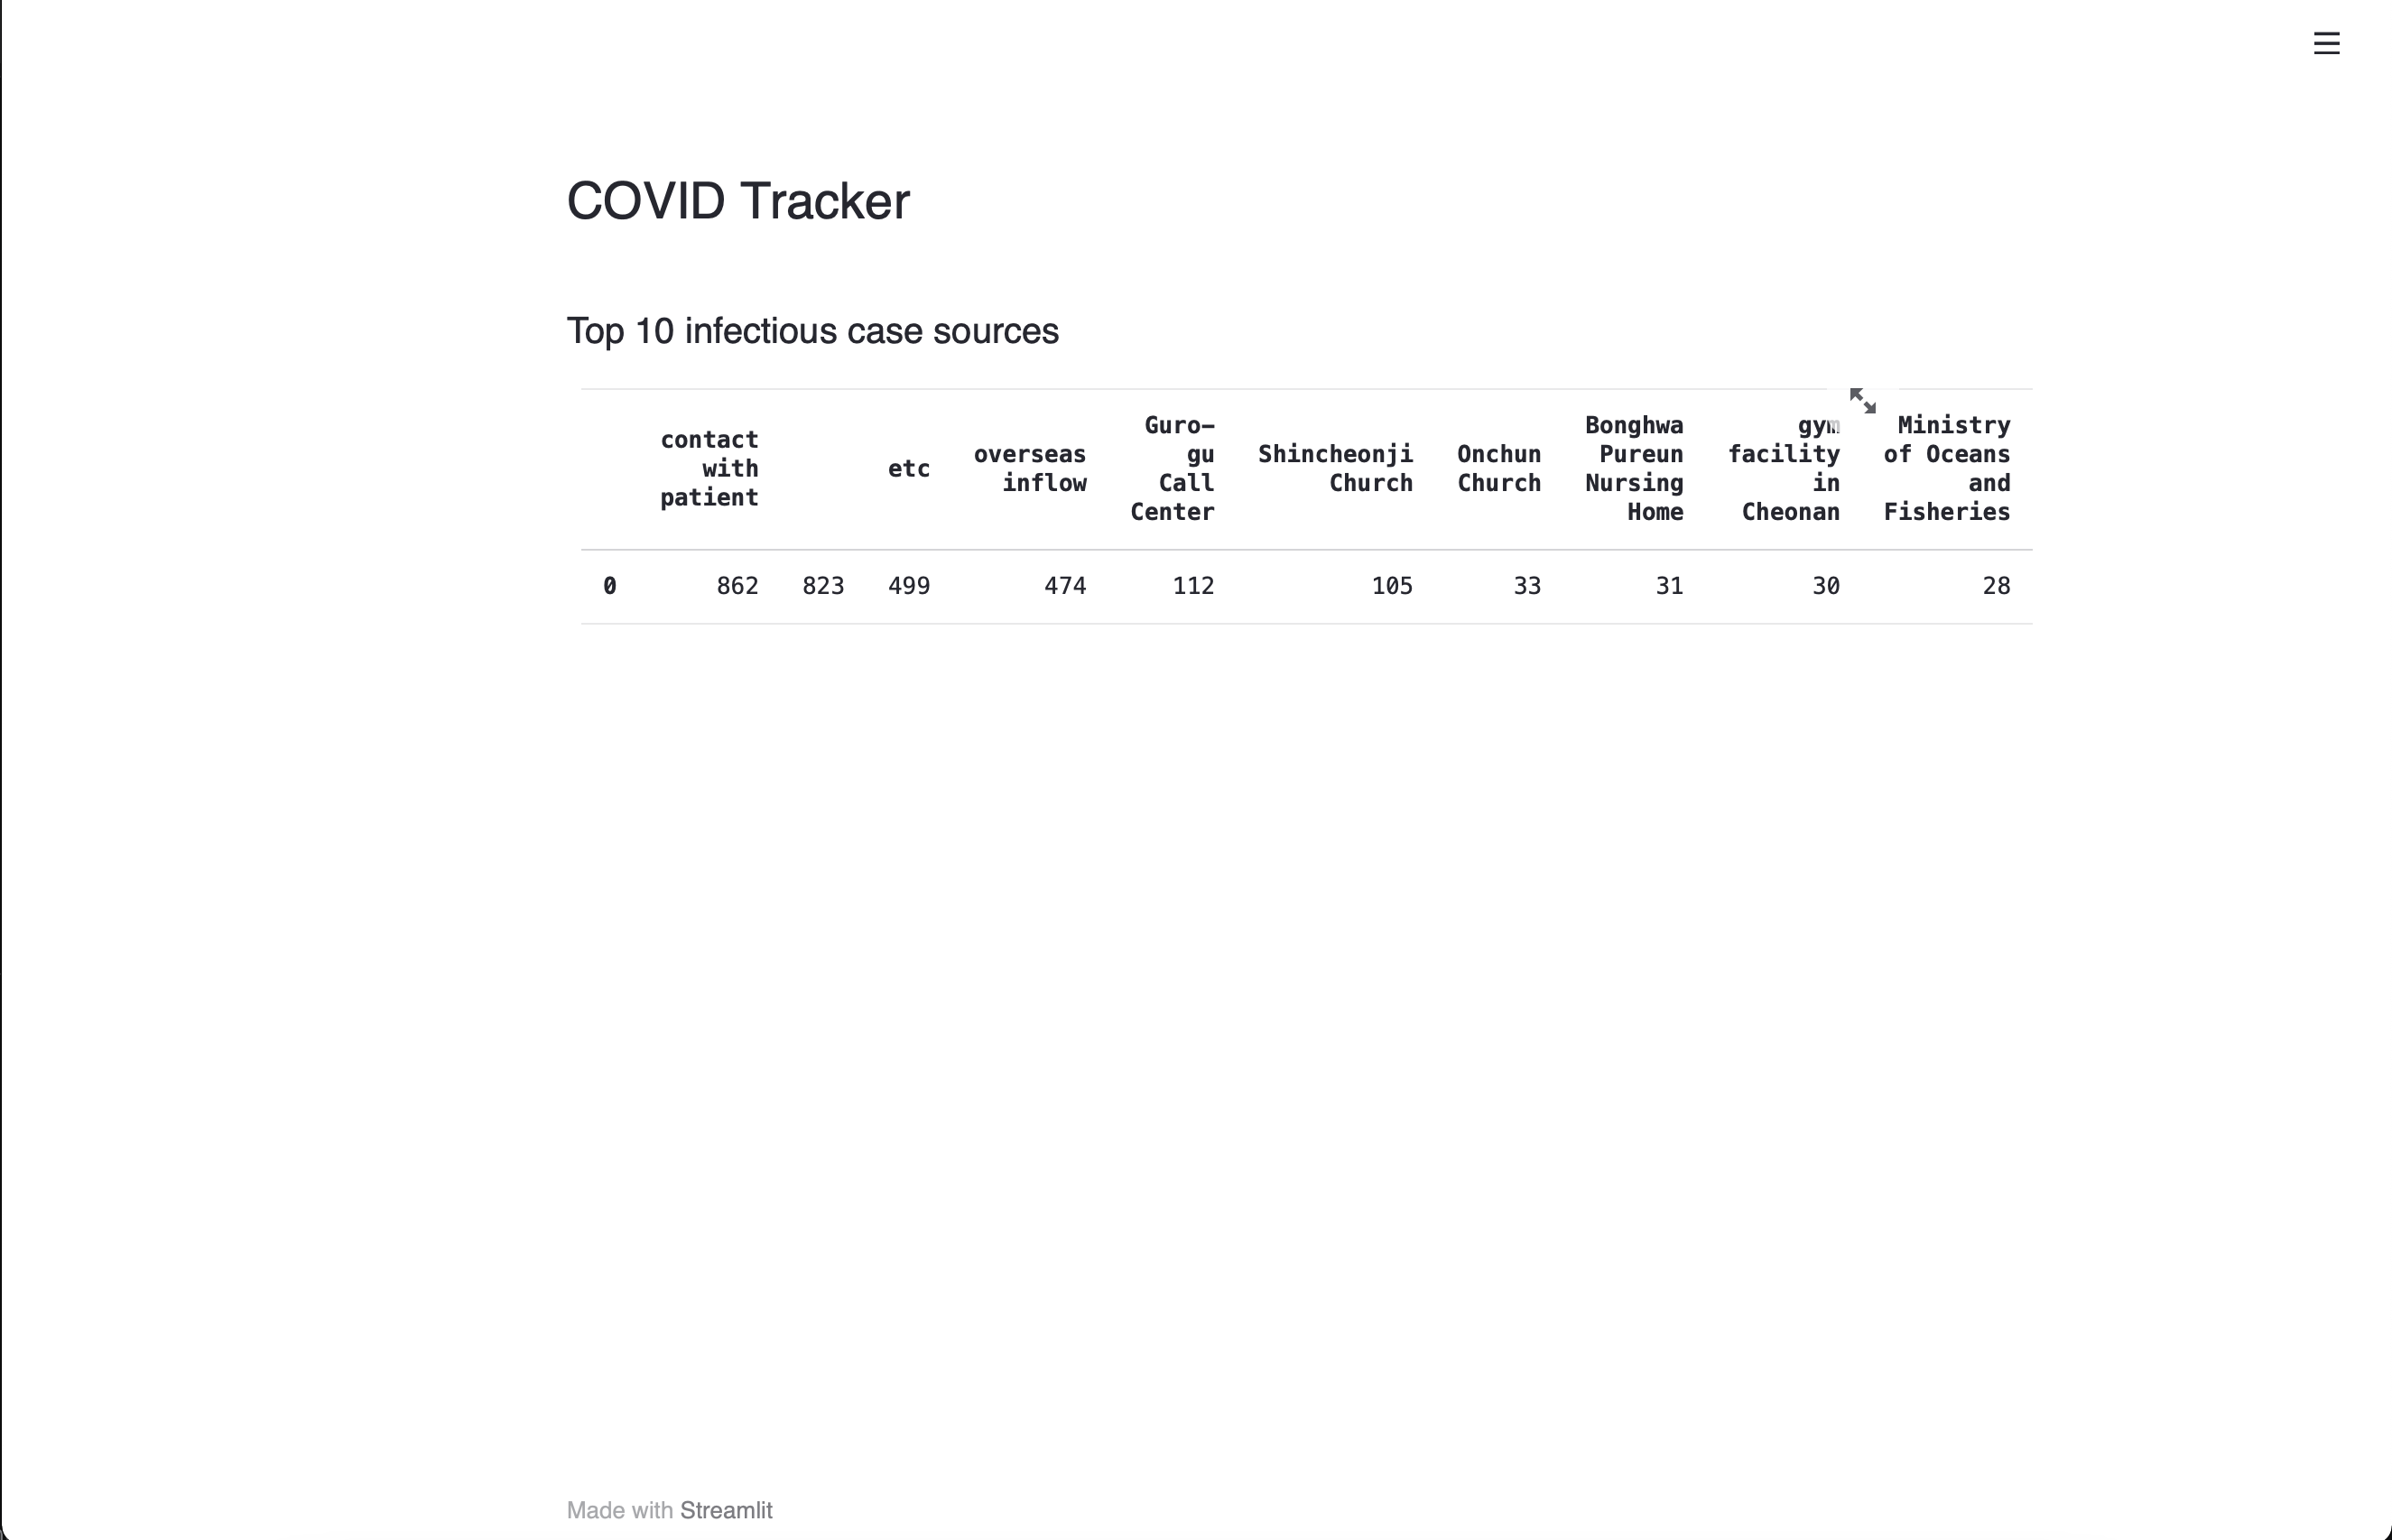
What it does
It simply displays the top 10 infectious cases from the dataset.
How we built it
I came to know about this hackathon a day before only. But learning is great.
- Tried to understand TigerGraph cloud - what can be done
- Then the foremost data I could capture is infectious cases resources.
- Then integrated that with streamlit.
Challenges we ran into
- Since it was the last day I came to know about this hackathon I was unable to look deeper into the dataset.
What we learned
Found many interesting insights from the dataset.
- Found the top most infetcious cases.
- Found how the disease got distributed among people based on sex and age.
- Found interestingly how a single person can spread the disease to others - "contact of patient" case
- Found which countries are populated with more cases.
What's next for Covid Tracker
Since only the first case was developed in this phase, I would like to develop all the cases in the next phase. Since many more insights can be found in this case.


Log in or sign up for Devpost to join the conversation.