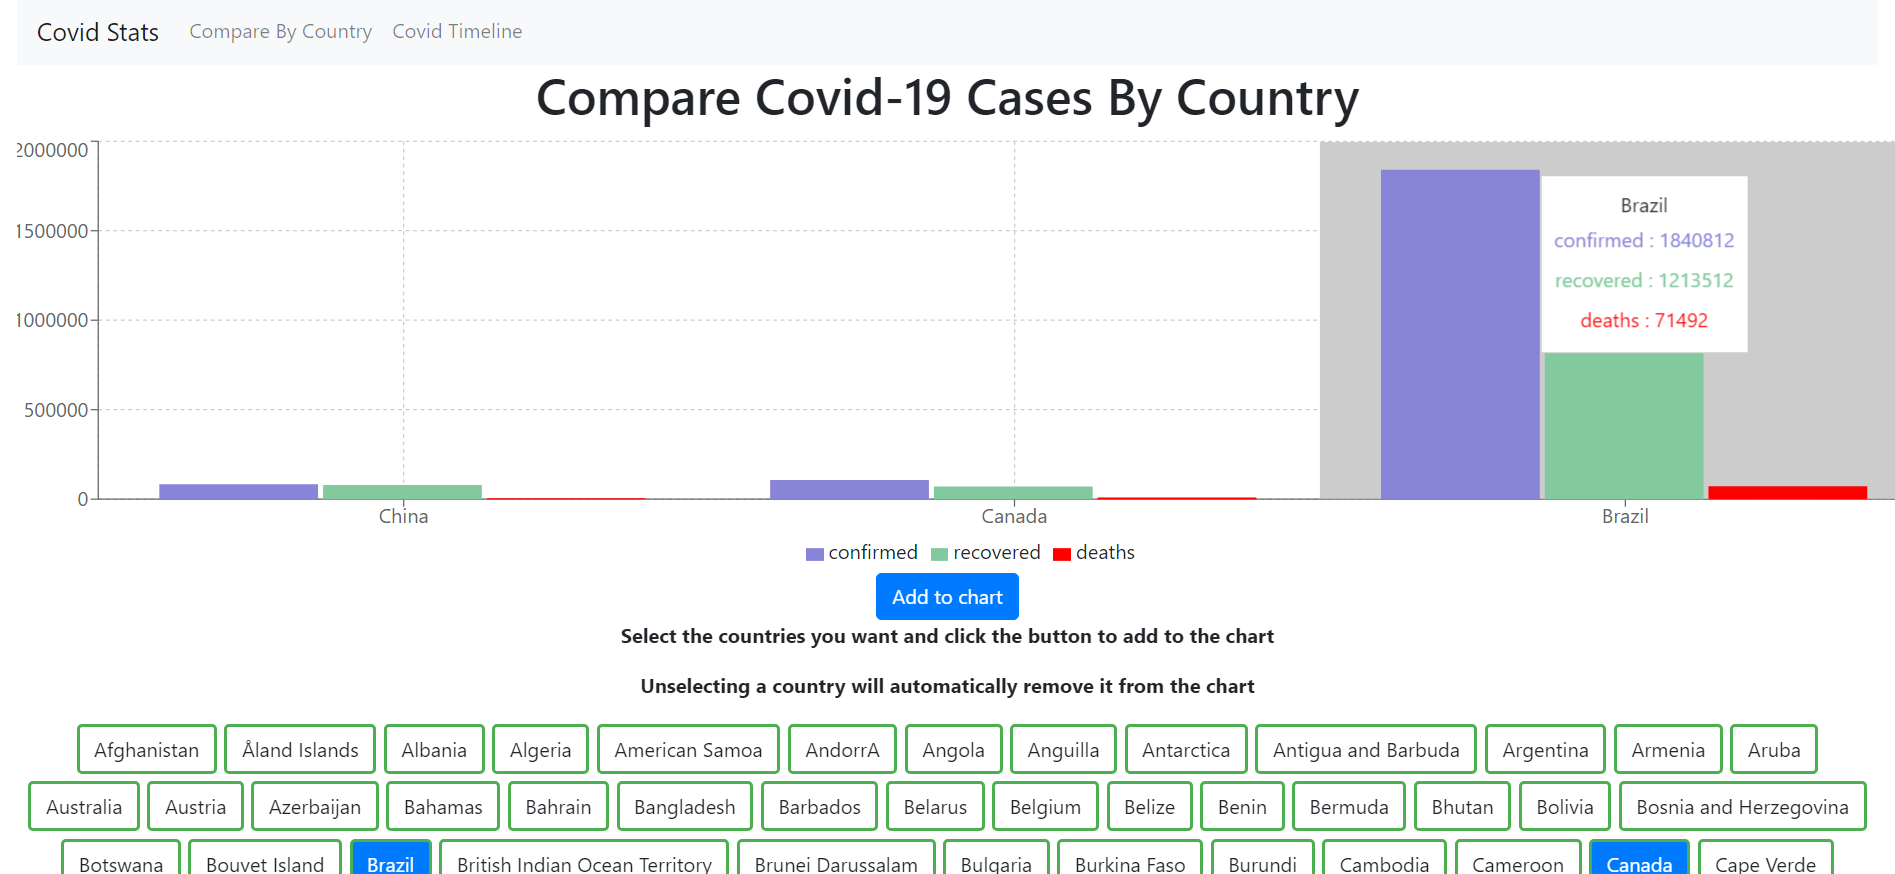
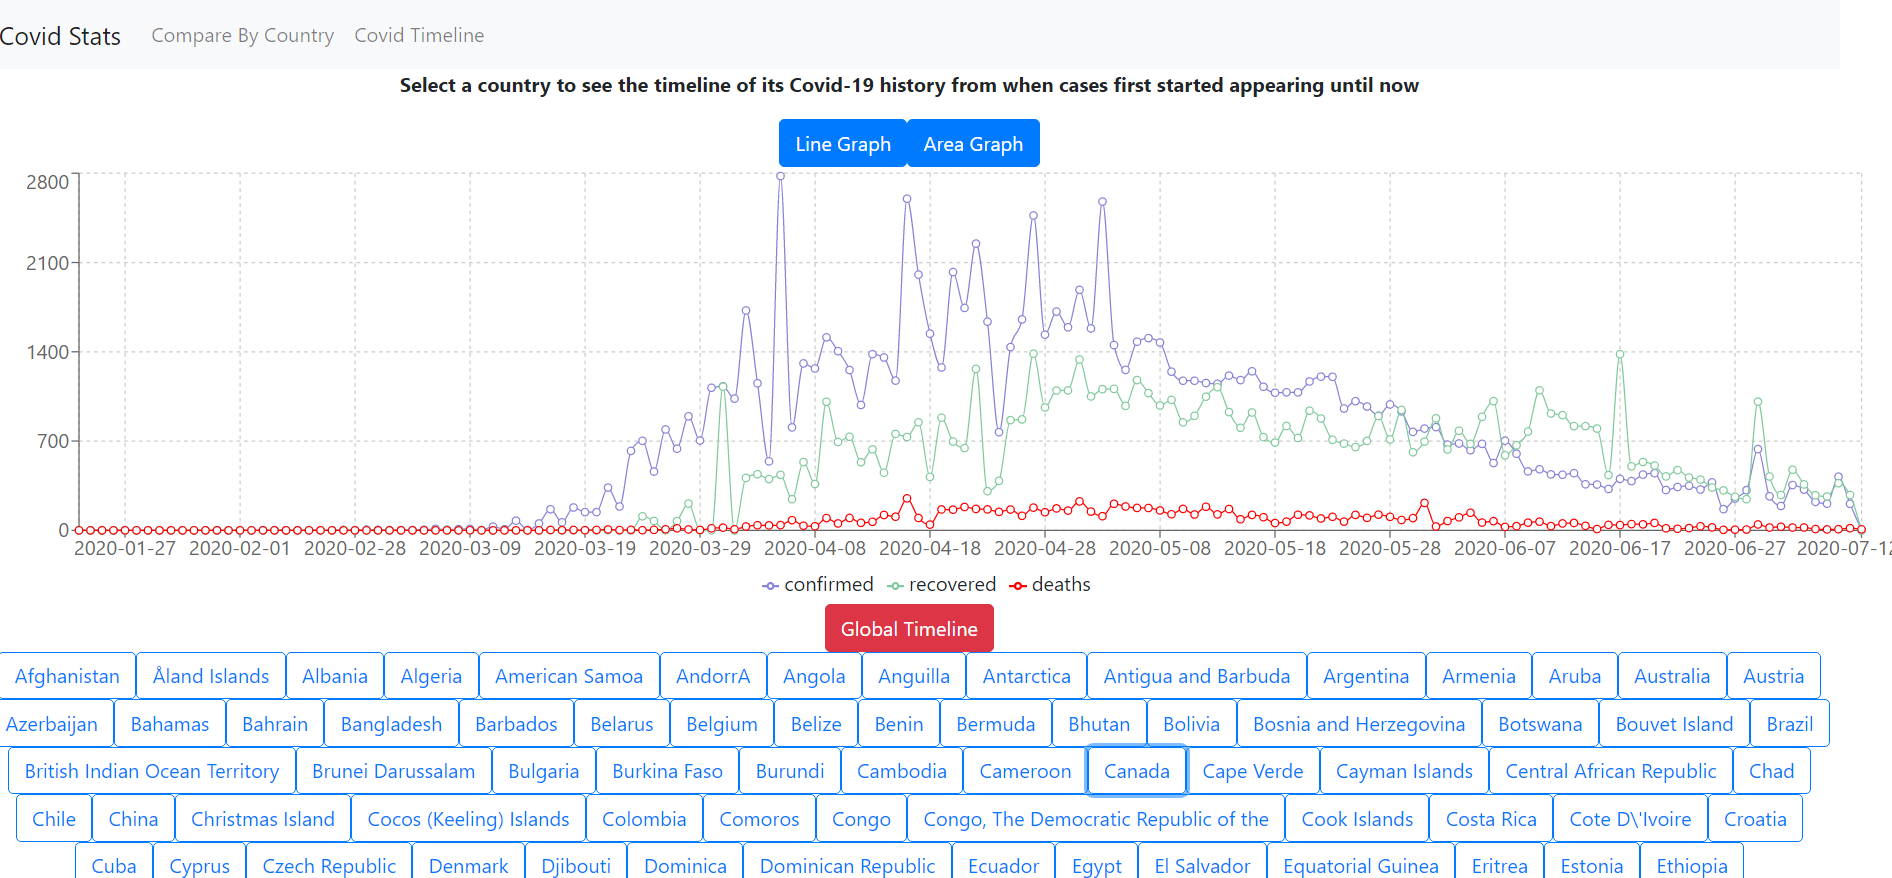
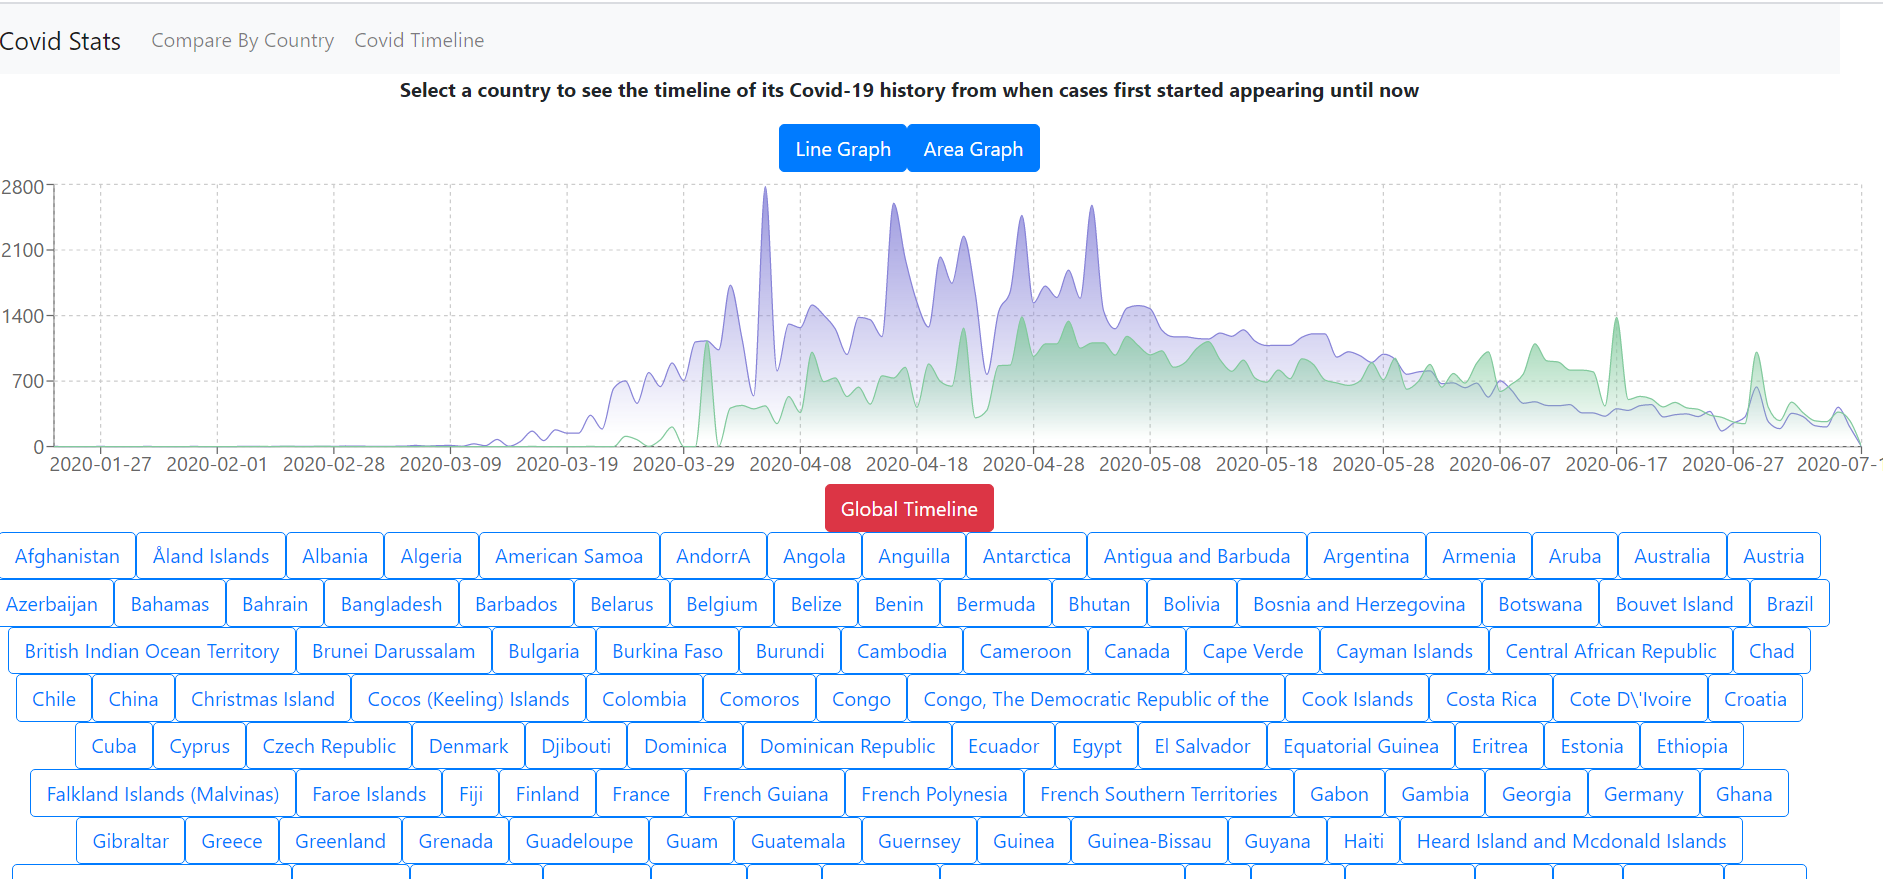
This is my first hackathon so I decided to keep things simple. I needed a project for my portfolio where I use a web API to get data before visualizing it. I figured I should stick with 2020's theme of Covid-19 and I created an application that visualizes COVID-19 statistical data. You can compare the confirmed, recovered, and killed stats of any country and you can see a timeline of cases from when cases first started appearing until today.
A demo of the app can be found here: https://covid-data-visualizer.vercel.app/
Tech Stack
- React
- Next.js
- ReCharts
- Vercel
- Corona Stats Web API (https://about-corona.net/documentation)
Built With
- bootstrap
- css
- html
- javascript
- next.js
- react
- rechart
- vercel
- webapi

Log in or sign up for Devpost to join the conversation.