-
-
the introduction at the top of the page
-
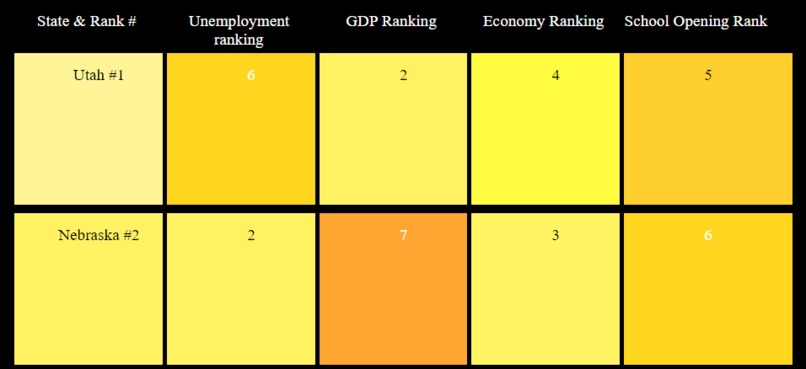
top 2 states on the list
-

the state that was determined to have handled covid-19 the worst


Inspiration
My inspiration for this project was a PDF I had fount that was a report of how each state was handling Covid-19.
What it does
This project simply displays the overall, and category specific rankings of how each state handled Covid-19 through easy-to-understand colors and visuals.
How I built it
I built this project using HTML and CSS, and I used Excel to extract and organize data from the PDF.
Challenges I ran into
My main challenges in this hackathon were missing imports, and time. I spent too much time trying to fix missing imports on a different project in the beginning, and when I finally realized I couldn't make it happen in the timeframe, I had already spent hours on it. Another challenge is that I am quite new to anything web related, so this project got the best of me time and time again. Despite all of this I tried my best to use my time to learn as much as I could rather than try to be the best at what I was doing.
Accomplishments that I'm proud of
Something I am proud of, although it's not really programming, was learning to use Excel to my advantage creating strings of code that would have otherwise taken much longer. For the grid I needed the information in a string of code that I was able to generate with the spreadsheet rather than have to type it all by hand!
What's next for Covid Safety by State
Up next for this project I most likely the addition of more information as well as some more interactive elements of the site. I would love to eventually learn JavaScript!

Log in or sign up for Devpost to join the conversation.