-
-
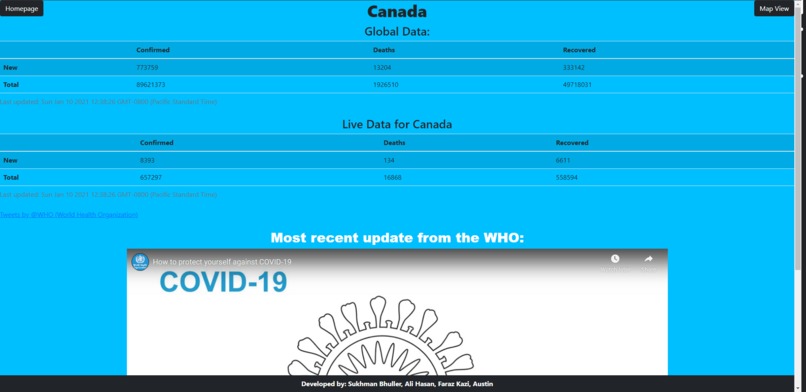
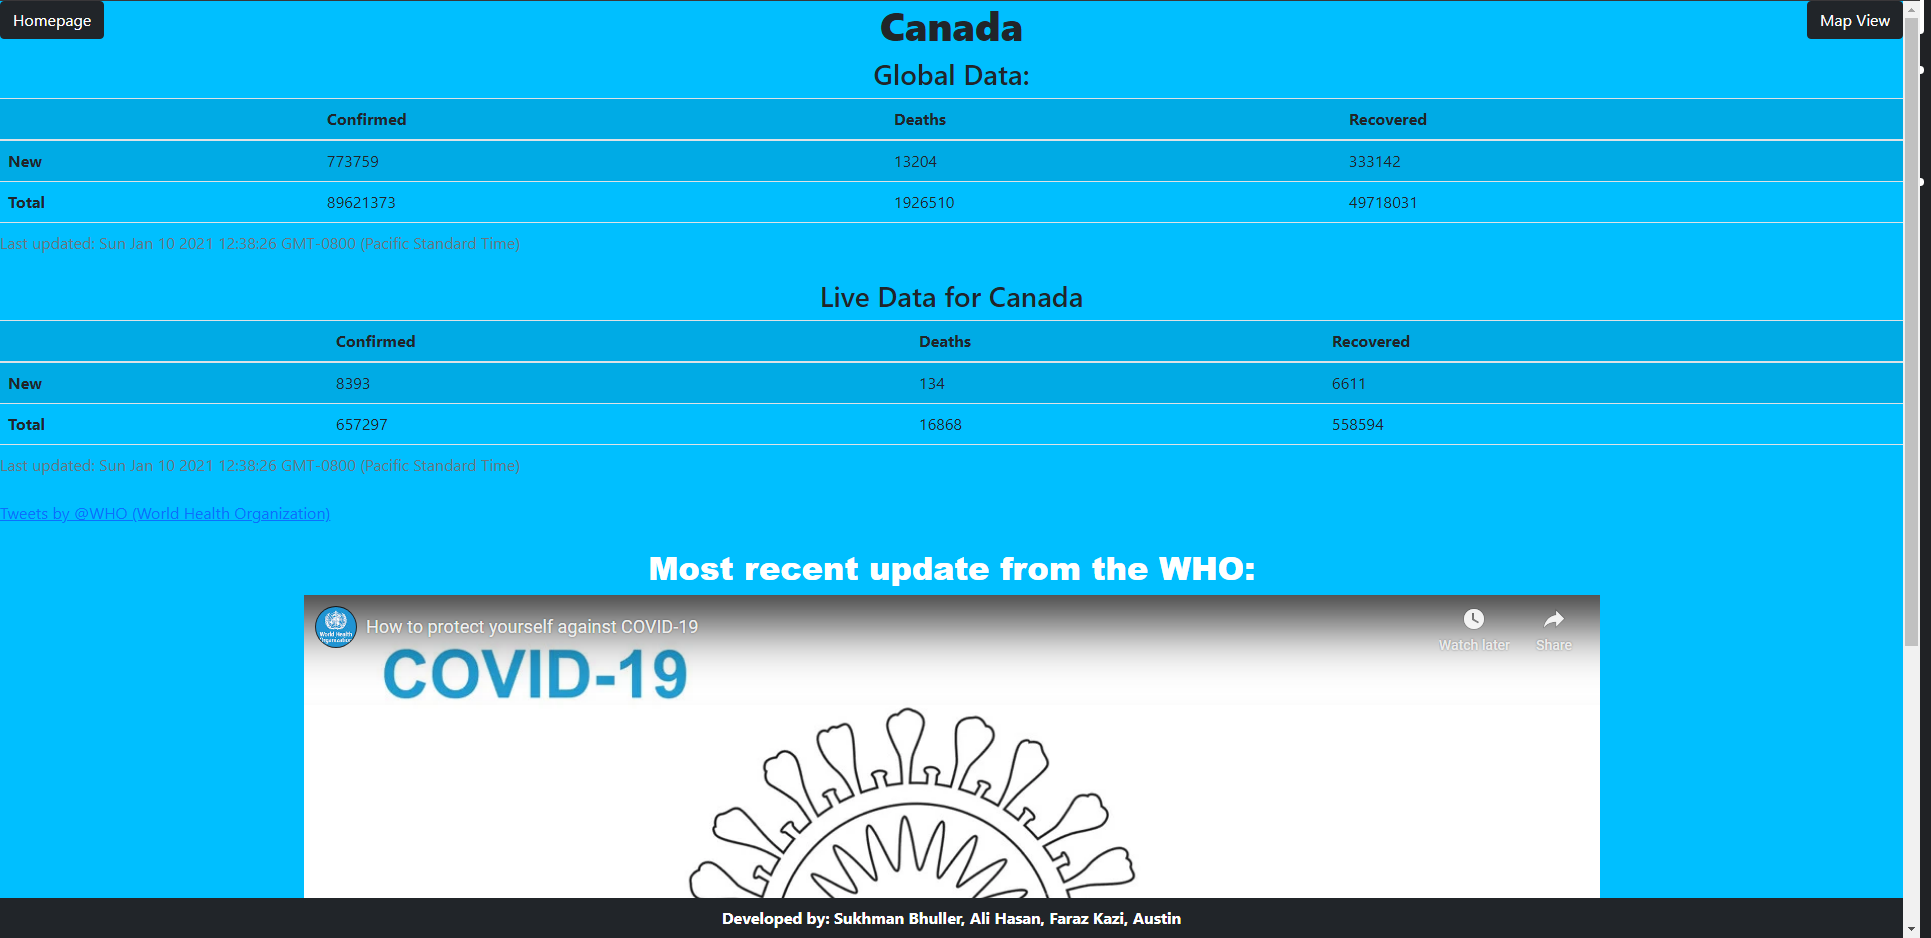
Country Data Page
-
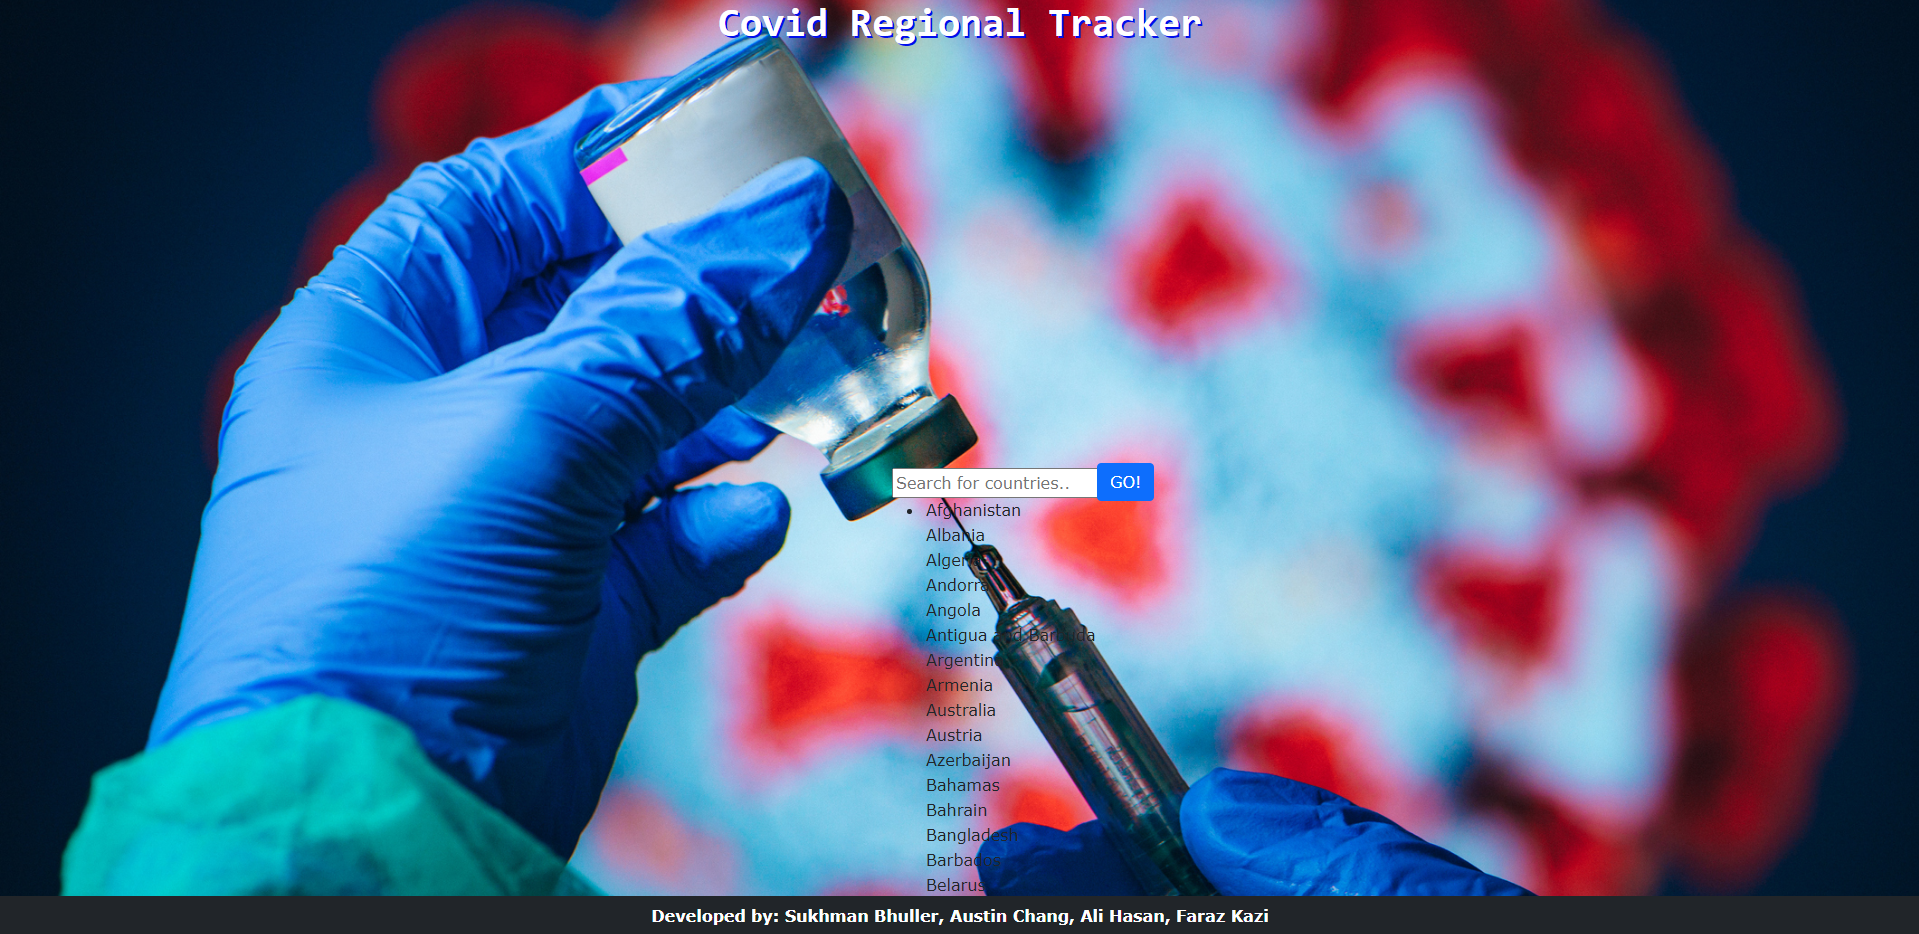
Main Page
-

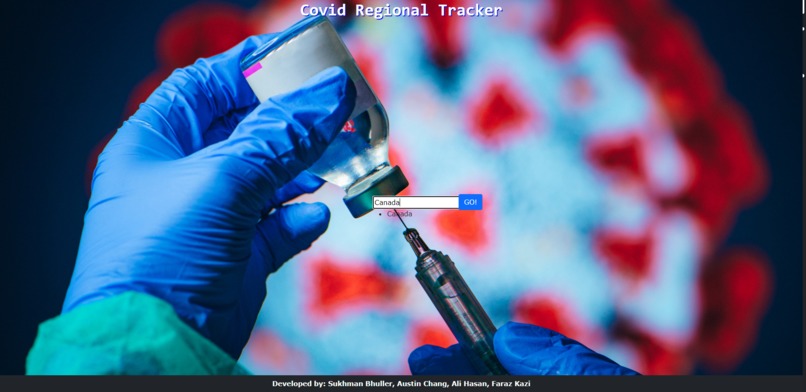
Main Page with Search

Inspiration
Covid has been a large part of all of our lives for almost a year. Everywhere we go, we are reminded to social distance and follow health recommendations. It can be easy to think the worst is behind us, but the numbers tell the real story. We built an app that shows the live damage of covid.
What it does
Fetches live covid-19 data from postman. Main page allow you to search based on country and then takes you to page with live covid data of that country
How I built it
We used HTML/CSS/JS because we wanted html as surcture, css for styling — we wanted a simple website, that was accessible to suers. Moreover, we wanted to try a library that we knew little about so we chose bootstrap. Bootstrap was able to give its a nice UI that was nicely presentable to users who come onto our website and was really accessible. Our backend is built using Django and javascript for performance and ease of use.
Challenges I ran into
We had issue implementing a robust search that worked regardless of case or improper spelling. We also had issues with performance in our search but we were able to get a very responsive search by optimizing. We also had trouble with our styling. Some of our divs and buttons were overlapping and we had to debug and make everything look aesthetic.
Accomplishments that I'm proud of
This was the first time any of us used an API. I'm proud of how the team was able to fetch data and properly decipher it and display it in a way it made sense and was visually appealing. I'm also proud of our use of GIt. This kept everyone involved and we were all up to date on the changes made to the project.
What I learned
As a team, this was our first time working with integrating APIs and using live data in a project. It was challenging, but a fulfilling process to be able to include live, actual data in our project. Additionally, for many in the group this was a new experience in using HTML and CSS to style a webpage. Learning how to use premade libraries such as bootstrap was another enriching experience.
What's next for Covid Regional Tracker
In the future, we hope to include a heatmap which tracks regional data and provides a visually appealing interface for users to interact with. Other changes will include a drastic revamp of the UI as well as including vaccination data to go with our original goal of creating a sufficient vaccination data tracker.


Log in or sign up for Devpost to join the conversation.