-
-

Logo
-

Landing page with local statistics
-

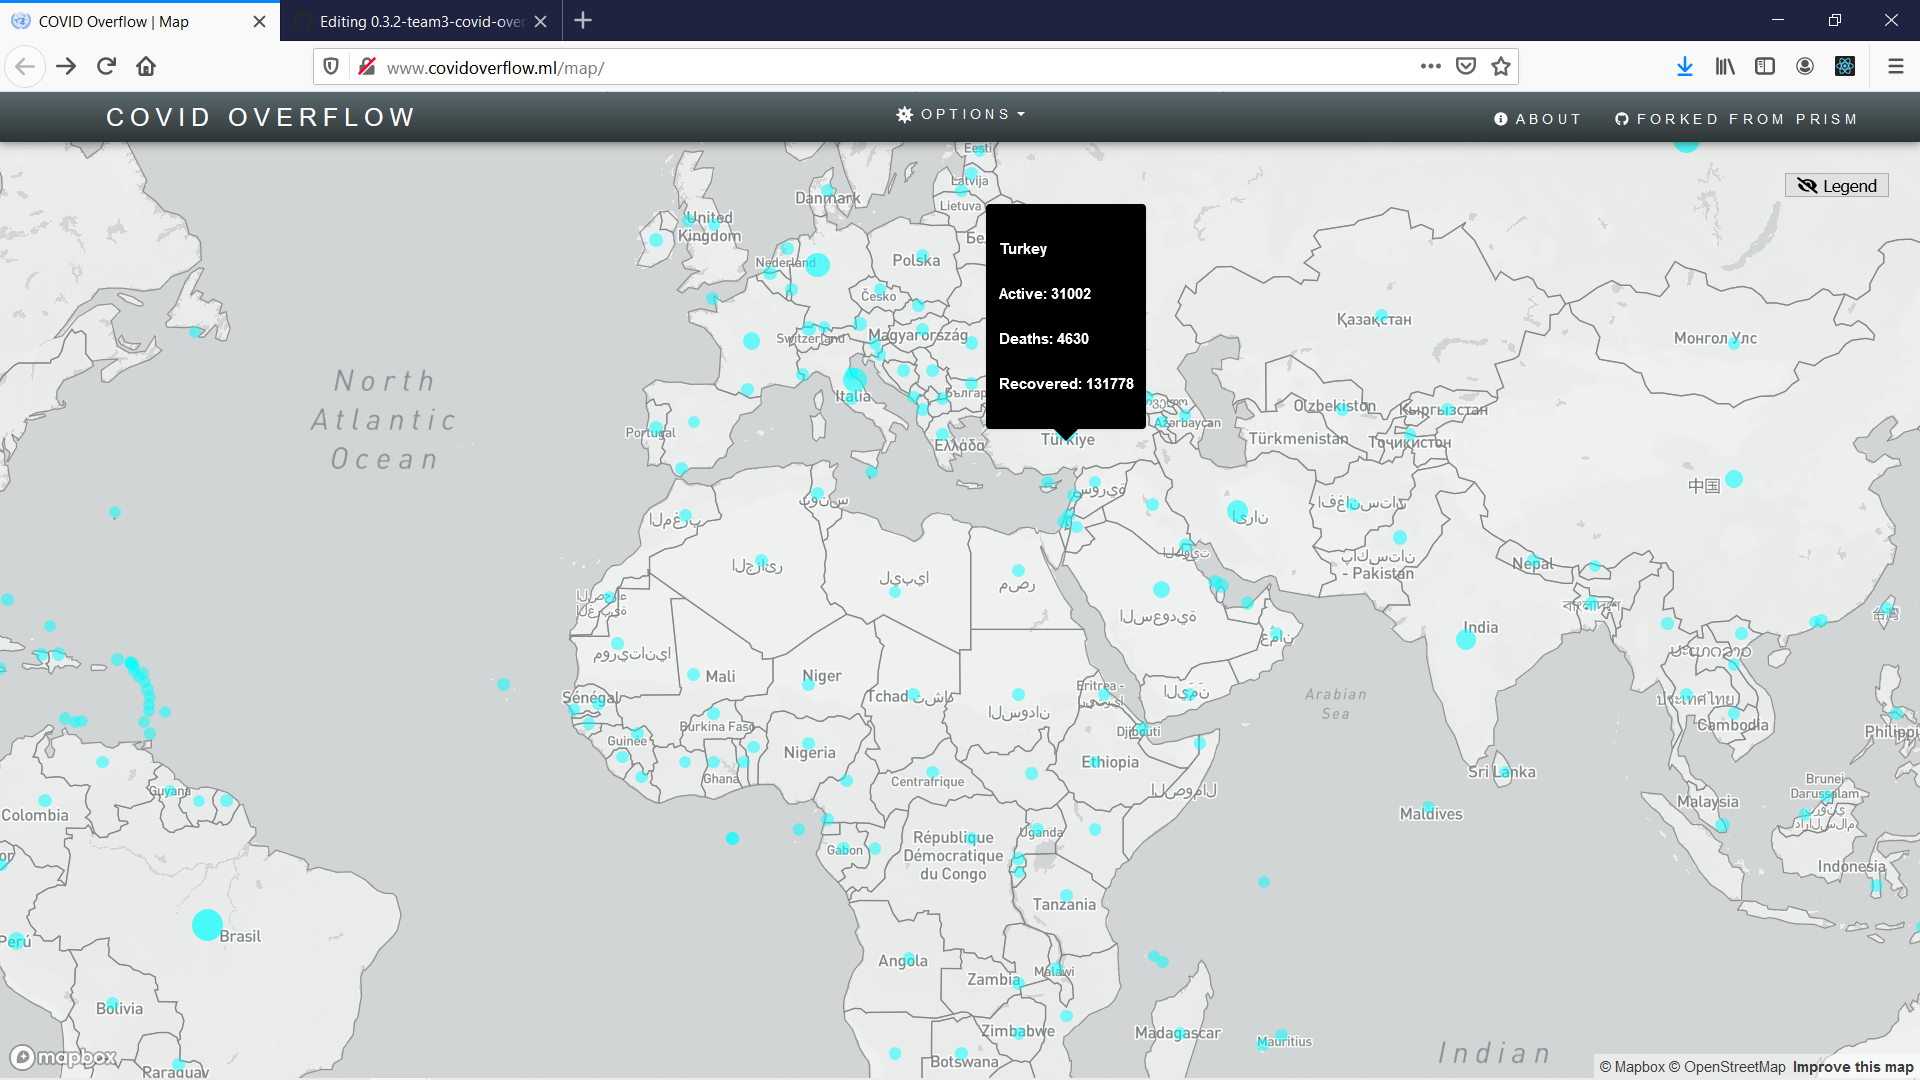
Interactive map
-

Toggle the switches to view different types of data
-

Click on the circles to find out more about the region
-

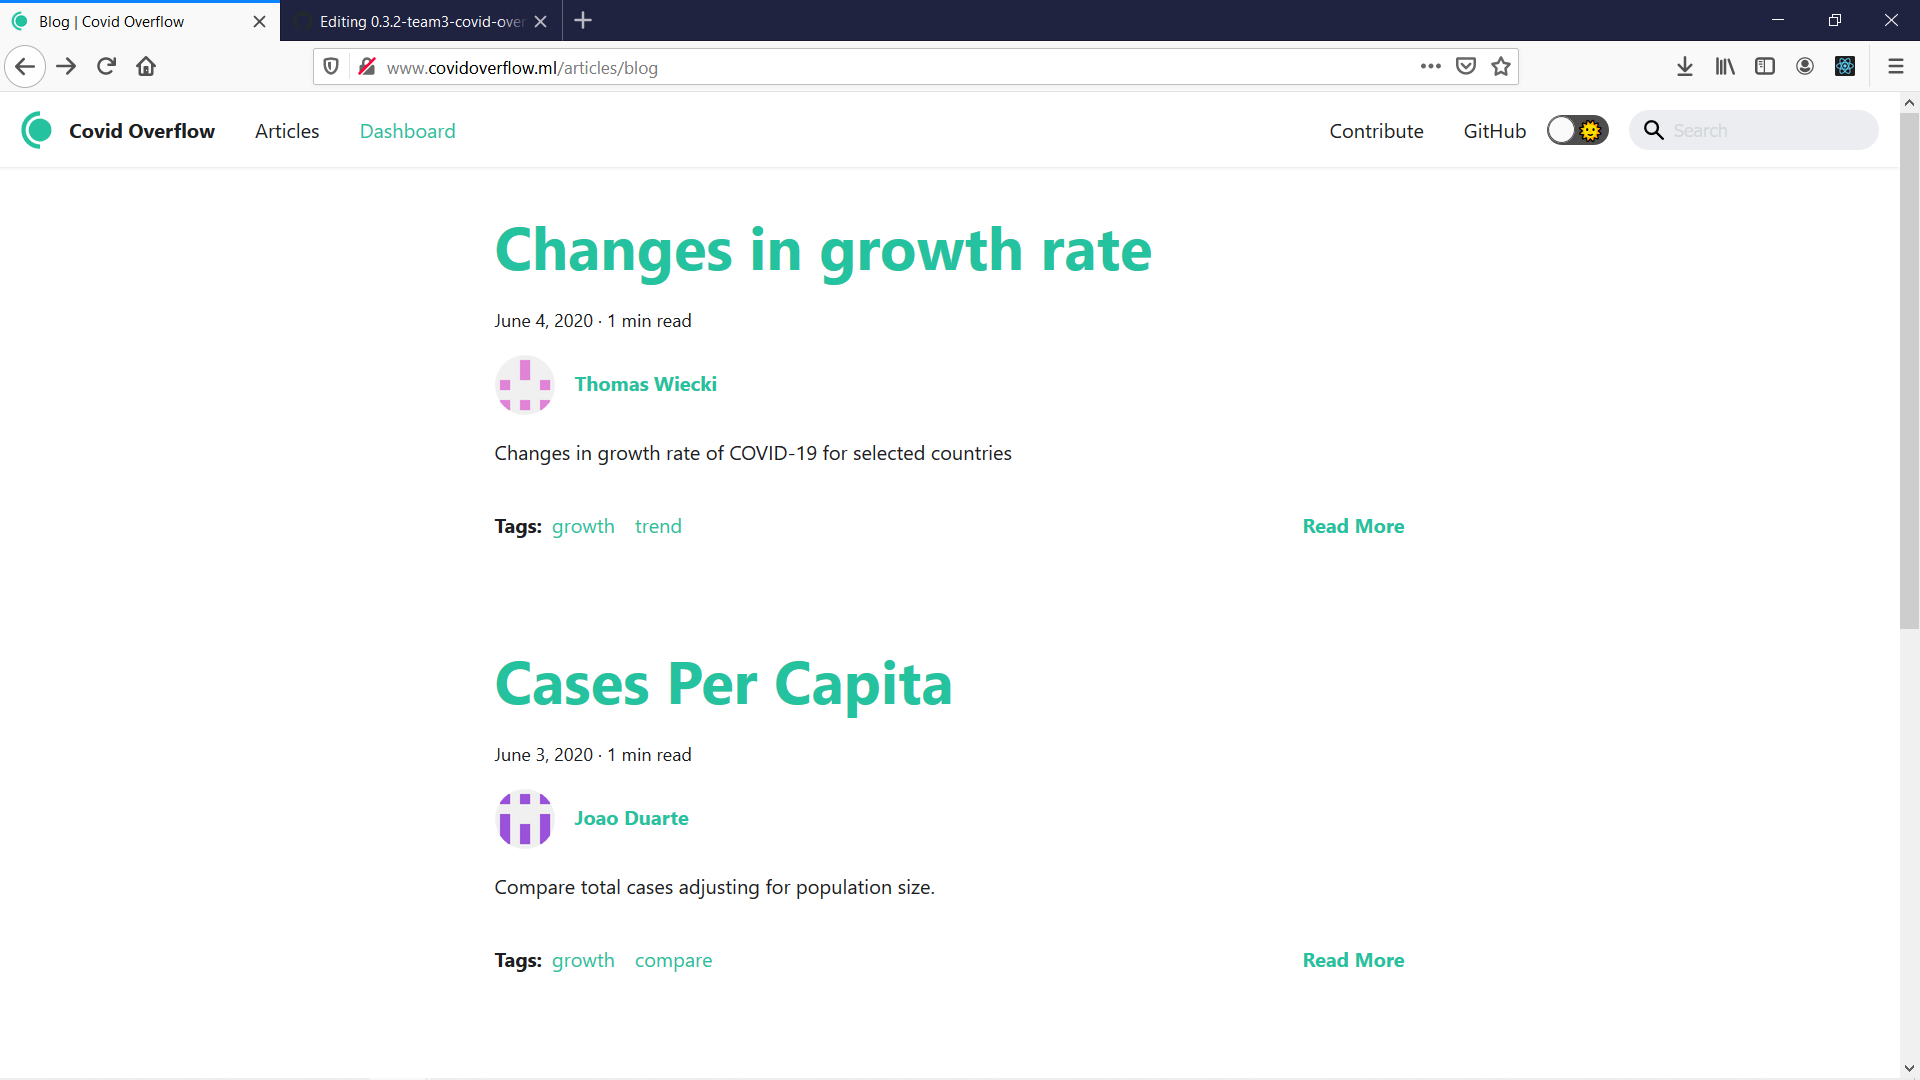
Users can edit articles by clicking on the edit link below
-

Articles link you to other useful applications
-

User can update articles using markdown
-

Dashboard for data visualizations
-
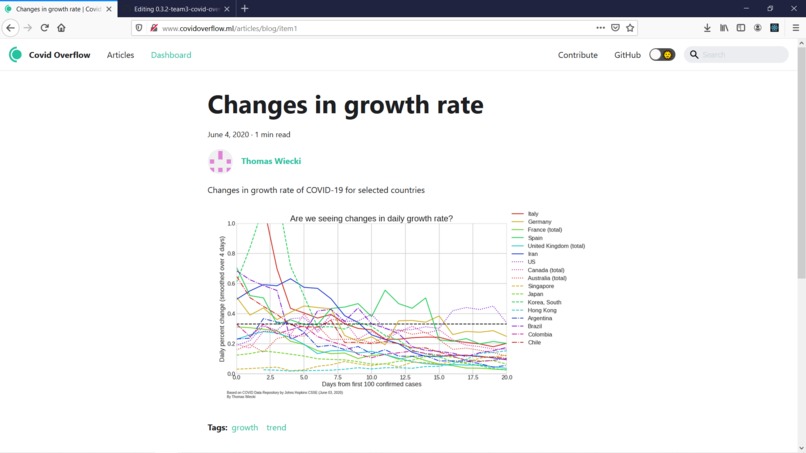
Expanded data visualization post


Inspiration
It's important for us to be well-informed during these troubled times. However, information and resources related to COVID-19 are disorganized. Furthermore, there is no shortage of baseless claims and COVID-19 misinformation floating around. This makes it difficult for us to stay informed.
We wanted to create a product that consolidates everything you need to know during the pandemic in one place. At the same time, we want to let users contribute their own articles and datasets to share with the world.
This is why we created Covid Overflow - a place to read articles, view data visualizations, publish your own, and interact with a world map showing the impact of COVID19 in more than 200 countries.
What it does
Covid Overflow consolidates information and resources related to COVID-19. The goal is to have everything you need to know about COVID-19 in one place. The key features are:
Landing page with local statistics: Covid Overflow allows anyone, anywhere to view the current status of their country with ease, right from the landing page. It uses geolocation to serve the current statistics for your country.
Interactive map with global statistics: If you want to see the big picture, we have an interactive map that displays worldwide statistics for COVID-19.
Articles which you can update: The Article page contains fact-checked information about COVID-19 and links to useful applications. Users can update these articles by clicking on the edit link at the bottom of each page. The file is written in markdown format, so it is incredibly simple to edit. The pull request will then be verified by a maintainer. Users can search for articles using the search bar.
Dashboard which you can update: The Dashboard page contains data visualizations about COVID-19. Users with experience with data analytics can share their data visualizations on this page by clicking the “Contribute” button. Existing data visualizations can also be updated. This allows users to share their data visualizations without the hassle of creating their own sites.
How we built it
Covid Overflow was built with all 3 open-source technologies that was assigned to our team.
Next.JS powers our landing page. Next.JS made it simple for us to implement styles and call the COVID API using server-side rendering.
Docusaurus powers our articles and dashboard pages. Docucaurus allows website documentation to be written in markdown files, which makes it easy for readers to contribute to the documentation. We repurposed this feature to allow users to post/update articles and data visualizations.
PRISM by WFO - A prebuilt application used by WFO to display crucial map data from JSON files. We edited PRISM to display data from the COVID API instead, making this complex implementation feasible for a 3-day hackathon.
These technologies contained their own stacks, and we also used our own. The main technologies used were React, Redux, Typescript, Mapbox, Express. Since these 3 applications alone are incompatible, we used Express to route them together under one domain, giving the illusion that they are contained within the same site.
Challenges we ran into
Our first challenge was trying to work out how to link the 3 open-source technologies together. We first thought it would be possible through Next.js. However, due to its server rendering system, PRISM didn’t work too well with Next.js as it used a client rendered map. We were quick to find a work-around and decided to go with Express to route these 3 sites together.
While unconventional, Express allowed us to achieve our goal of a seamless deployment and user experience. So, we managed to integrate 3 seemingly incompatible technologies into one seamless web application.
Accomplishments we are proud of
We’re proud of creating an interactive map for visualizing COVID-19 data. We were also able to personalize some of the data in our application depending on the user’s location. This makes the data more relevant to the user.
We’re also proud of creating a simple workflow for the users, which allowed us to crowdsource articles and data visualizations from users. This allows credible but less well-known sources to share their contributions and join the fight against COVID-19.
What we learnt
This was the first remote hackathon that we participated in. We learnt how to work effectively in a distributed team. We communicated frequently through synchronous and asynchronous channels. We also set up project boards so that all of us are aware of the project’s progress.
Through this hackathon, we learnt the importance of good project management practices, especially in a distributed team. We reviewed each other’s pull requests to sniff out possible bugs and keep ourselves updated with the changes made.
What's next for Covid Overflow?
Currently, our interactive map displays only the latest COVID-19 data. We want to improve our interactive map by providing a visualization of how the COVID-19 situation has progressed. This means that we need to display COVID-19 data for different timings and give the user the option to select a timing of interest. This will be useful for learning about the trend and impact of COVID-19 over time.
We also intend to personalize some of the data shown to the user. It would be great if the articles link to the applications that are supported in the users regions. For example, contact tracing applications are usually created for a particular region. In that case, we should suggest the contact tracing applications that are available in the user’s region (instead of a list of all contact tracing applications). This will make the information more relevant to the user.
Built With
- docusaurus
- express.js
- mapbox
- material
- nextjs
- node.js
- react
- redux
- typescript


Log in or sign up for Devpost to join the conversation.