-
-
Webpage

Inspiration
In a world as crazy as ours, misinformation dominates the news, and people begin to become wary of information. Furthermore, the vast amounts of data make it hard to digest when it comes to making decisions about how safe it is.
We strive to change that by providing real, grim data to help health officials keep people home to flatten the curve.
What it does
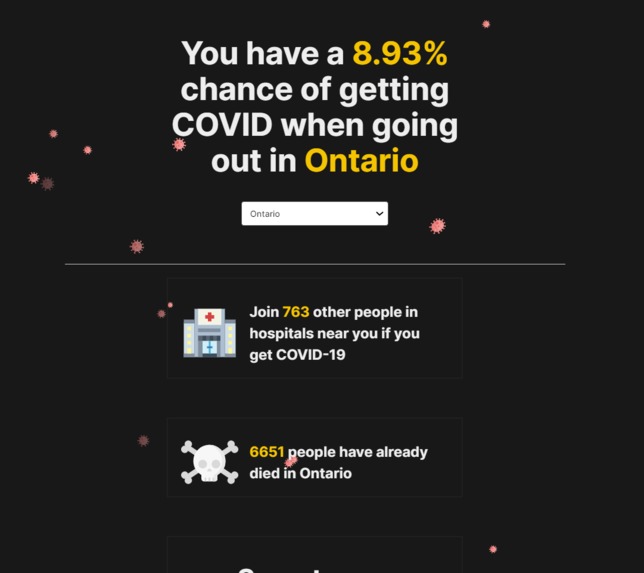
We made a web-app that connects to the covid statistic API to gather data, and using probability calculations, shows you a chance that you might contract covid every time you go out. It also shows you the death/hospitalization rates near you, so that you'll think twice next time you want to go to your friend's house for a party or attend a large wedding during the lockdown.
How we built it
The display is built with HTML to set the structure in place, and have all the tags ready. We used a combination of CSS framework, SCSS, and CSS from scratch. The CSS we wrote helped us create amazing animations like the floating virus icons in the background, to the typewriter effect in the "symptoms" section. Finally, we used JavaScript to connect to the API, pull data, mould the data, and manipulate the DOM of the page.
Challenges we ran into
Since we learned everything from scratch, every step was a struggle. From trying to understand how to compile SCSS to CSS, to connecting APIs using JS, to deploying websites on firebase, we really struggled and preserved through all the technical challenges thrown at us.
Accomplishments that we're proud of
We're so proud of all the subsections we made on our website. We complete a full website and that's an amazing achievement for every member of our team.
What we learned
We learned how to extract specific data from an API using JavaScript. We also learned how to code animations such as the typewriter effect and animated background. Most importantly we learned how to work in a team with new people in a remote environment. We used an extension on Visual Studio Code called Live share that allowed our entire team to edit a project folder all at the same time.
What's next for COVID-LESS
Adding more statistics, specific data, data of cities and regions, graphs and charts, new findings of Covid-19.
Built With
- covid-19-statisticsapi
- css
- html
- javascript
- visualstudiocode


Log in or sign up for Devpost to join the conversation.