-
-
Our Logo
-
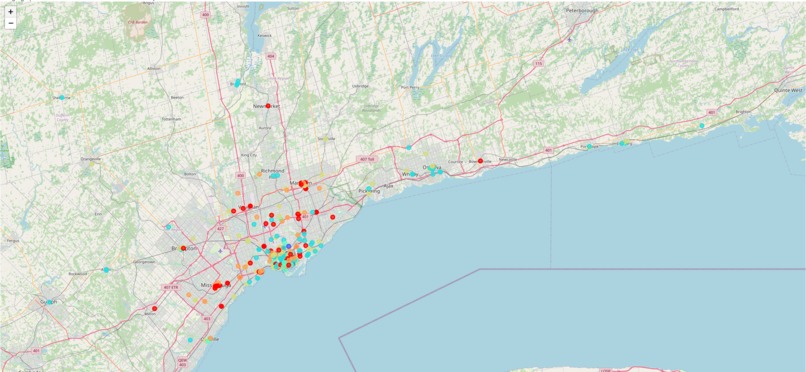
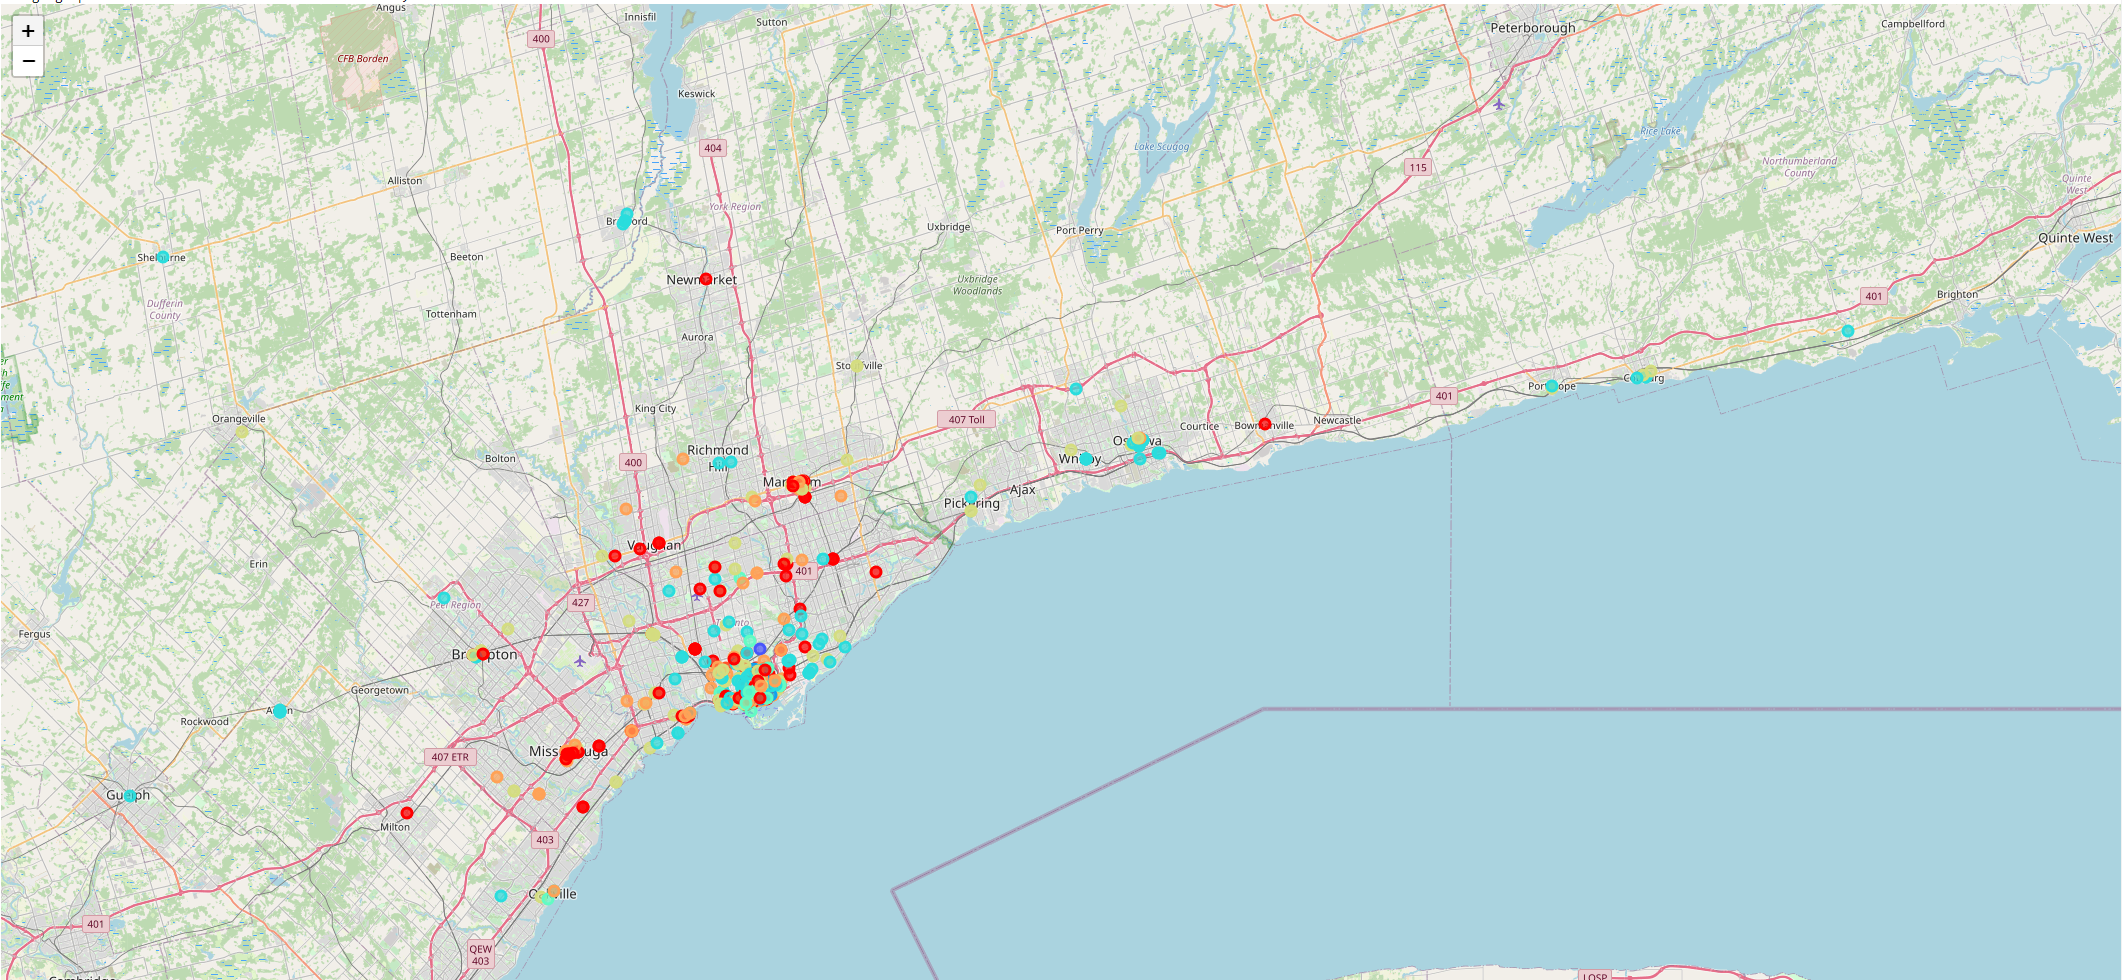
Map based housing prices clustering in GTA

Inspiration
When the pandemic hit, we witnessed one of the biggest economic crashes in recent history. With crashes in the stock market and inconsistencies in all markets and industries, one thing that never seems to change is the increase in value of homes across Ontario. Within the past 10 years, the housing market has gotten more and more competitive with houses that used to be affordable being valued at absurdly high amounts. This increase of value in home ownership has seen a decrease in home ownership percentage in proportion to Ontario’s population. This is where our project comes in. Our project aims to project accurate values for homes based on location and features that the homes have. It can be beneficial to people in the market for buying/financing a home or investment companies who manage large real-estate portfolios.
How we built it
In the first step, we were looking for a reliable dataset which was found on the Kaggle. Our housing price dataset has # of Bedrooms, # of Bathrooms, Address, size and # of parking slots and at the end its type and price. As you can see we graph our dataset to have a better understanding from it. To find out how many labels our prediction model needs we implemented K Means clustering and it resulted in 8 classes. However, to prevent dimension curse for our ML models we optimize the labeling by changing the thresholds and optimize it to four clusters. To visualize our clustering we used Google maps API as you can see in our demo which covered GTA. To develop our prediction model we performed the SVM, Decision Tree and KNN on our dataset. And we got good accuracy on each model but by plotting the ROC curve we found our models are overtrained and we need some other features for our dataset. In this stage we used an open data-source from the Toronto Open Data Portal which has the geolocation data of over 500 schools. //Some of these schools were omitted as they were outside the housing regions under consideration for our project. We merge these datasets by calculating the nearest school distances to each rental house in KM based. The rationale to include the school distance feature is that house prices increase if the property is located in close proximity to certain landmarks, including schools, hospitals, shopping malls, grocery stores, highways and parks. Amongst these, schools are at a premium as most people who can afford to buy a house in Toronto are at an age where they would already have school-going children. The remaining landmarks can be included in future iterations of our MVP. To predict the house prices we implement Linear Regression, Decision Tree and Neural Network. A decision tree is a decision support tool that uses a tree-like graph of decisions and their possible consequences, including chance event outcomes, resource costs, and utility. A decision tree is a flowchart-like structure in which each internal node represents a “test” on an attribute, each branch represents the outcome of the test, and each leaf node represents a class value. The paths from root to leaf represent regression rules. Based on the regression statistics, the model has a R2-Score of 98.3%, implying that the model explains 98.3% of the variability in final price with respect to the feature set. Linear regression attempts to model the relationship between two variables by fitting a linear equation to observed data. One or more variables are explanatory variables, and the remaining is the dependent variable. Our model has a R2-Score of 98.8%, implying that the model explains 98.7% of the variability in final price with respect to the feature set. Neural networks are the workhorses of deep learning. In this method, the model endeavors to recognize underlying relationships in a set of data through a process that mimics the way the human brain operates. While these networks are black boxes (their inner working is not explainable) they aim to accomplish the same thing as any other model — to make good predictions. Based on the regression statistics you can see, the model has a R2-Score of 98.8%.
What we learned
Our project encapsulates many different aspects of data science and machine learning, such as fitting data to make a strong prediction model and plotting all the data to create a visual representation. Throughout this process we learned how to analyze and deduce price ranges for different test cases based on multiple parameters. Some challenges along the way include not overfitting the data or overtraining the model so that the accuracy wouldn't be lower. Another challenge was reading the right data from the .csv file so that we could accurately classify different types of homes with different features and locations. Overall, the learning process of this project reflects the difficulties with deciphering useful data from redundant data to produce an accurate prediction which can be used for an accurate synthetic data dataset.
What's next for COVID effect on housing prices
Overall, the process for the development of our project was both challenging and insightful. As the market continues to grow with more dependencies coming into play, our model can only grow in value for people who are looking to buy or for investors looking to raise their company’s real-estate portfolio. Our project is mainly targeted to people who are working with the housing market, however, our model has the power to analyze shifts in cost and can possibly be further developed to determine the economy’s current state (ex: if there will be a recession or increase in economic prosperity). Our model isn’t only bound to give people insight on potential prices, it can also be used to develop synthetic data to accompany supervised and unsupervised neural networks. The possibilities for development are endless when it comes to generating synthetic data, and our model directly impacts that aspect of machine learning and data science.
Built With
- google-maps
- machine-learning
- python
- tensorflow


Log in or sign up for Devpost to join the conversation.