Inspiration
My family and I, we're Turkish and lately there has been an incredible amount of misinformation regarding COVID-19 circulating in social media. My friends and family also found it incredibly difficult to find reliable and up-to-date information available to the public! Hence, I decided to code this bot for Dataverse's Datathon.
What it does
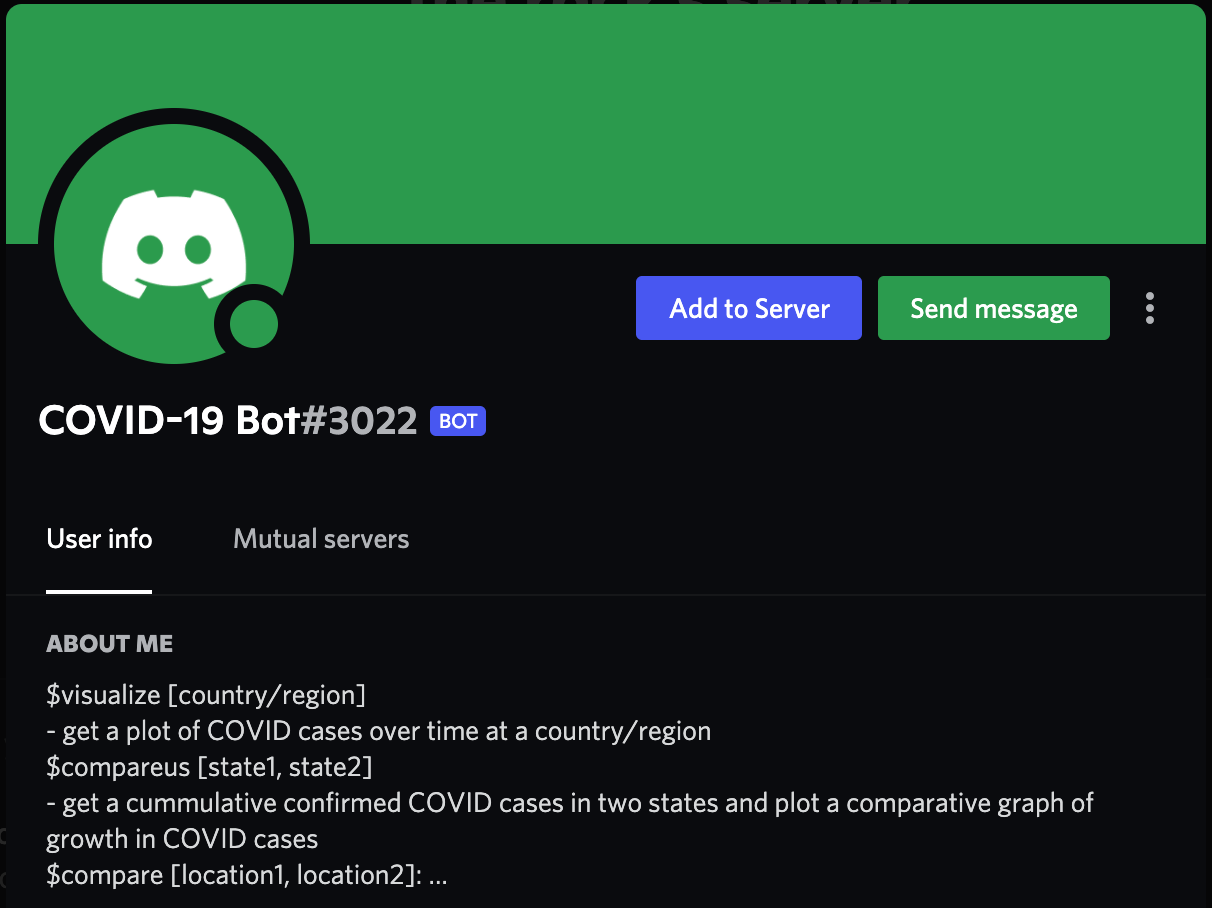
COVID Bot has 4 features so far. You can:
- visualize how a country/region has been doing with covid so far, utilizing Kaggle's most recent COVID-19 data sets and matplotlib's extensive plotting features
- compare two states, how their cases compare and the growth rate and plot the results over time
- compare any two country/region (same output as before!)
- get a random fact about COVID-19
How I built it
I used Kaggle API to obtain my data sets, used numpy and pandas dataframes for interpreting data, used matplotlib.pyplot for plotting (I was planning on using seaborn pairplots for more interesting correlation graphs, but I didn't have time) and finally I used Replit to host the Discord Bot.
Challenges I ran into
I have never used Kaggle before so it was difficult to use it right off the bat, however I really wanted to challenge myself and learn something new during this hackathon. The datasets were also a lot larger so keeping track of all the columns was challenging but nothing that pandas can't handle.
Accomplishments that I'm proud of
I'm proud that the bot produces graphs and that it works pretty quickly given the little amount I had left to optimize it. I'm proud that I used a lot of pandas features I've never used before and that I implemented Kaggle!
What I learned
I'm not a data science student or have taken any data science courses, so I learned about that! I learned about different data science libraries, different features of pandas and how to pinpoint data from a large dataset and play with it, visualize it.
What's next for COVID Discord Bot
I would really love to implement the pairplot feature that I was hoping to implement. I need to browse some dataset libraries to find one that would be suitable for it, so I couldn't do it this time around. And of course add more facts to the COVID Factsheet.


Log in or sign up for Devpost to join the conversation.