-
-

Home page with menu bar open.
-
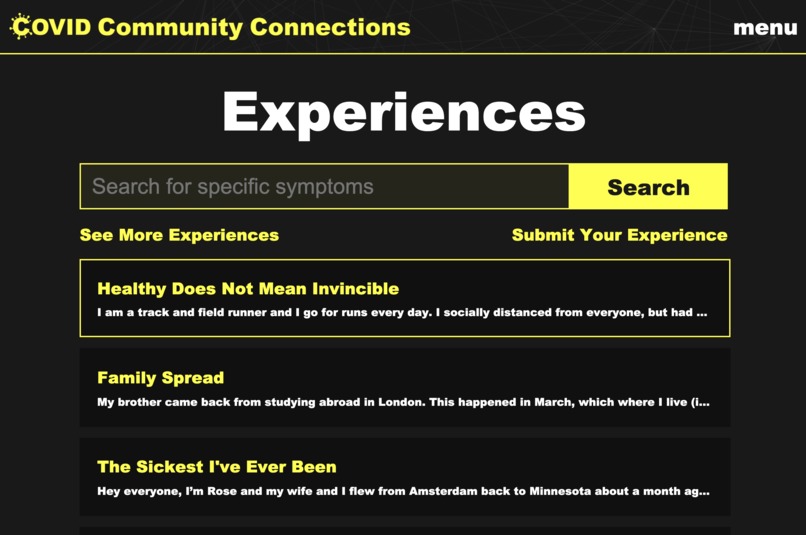
Experiences page where you can view people's stories of dealing with COVID-19.
-

A sample experience.
-

The form where people can submit their experiences.
-

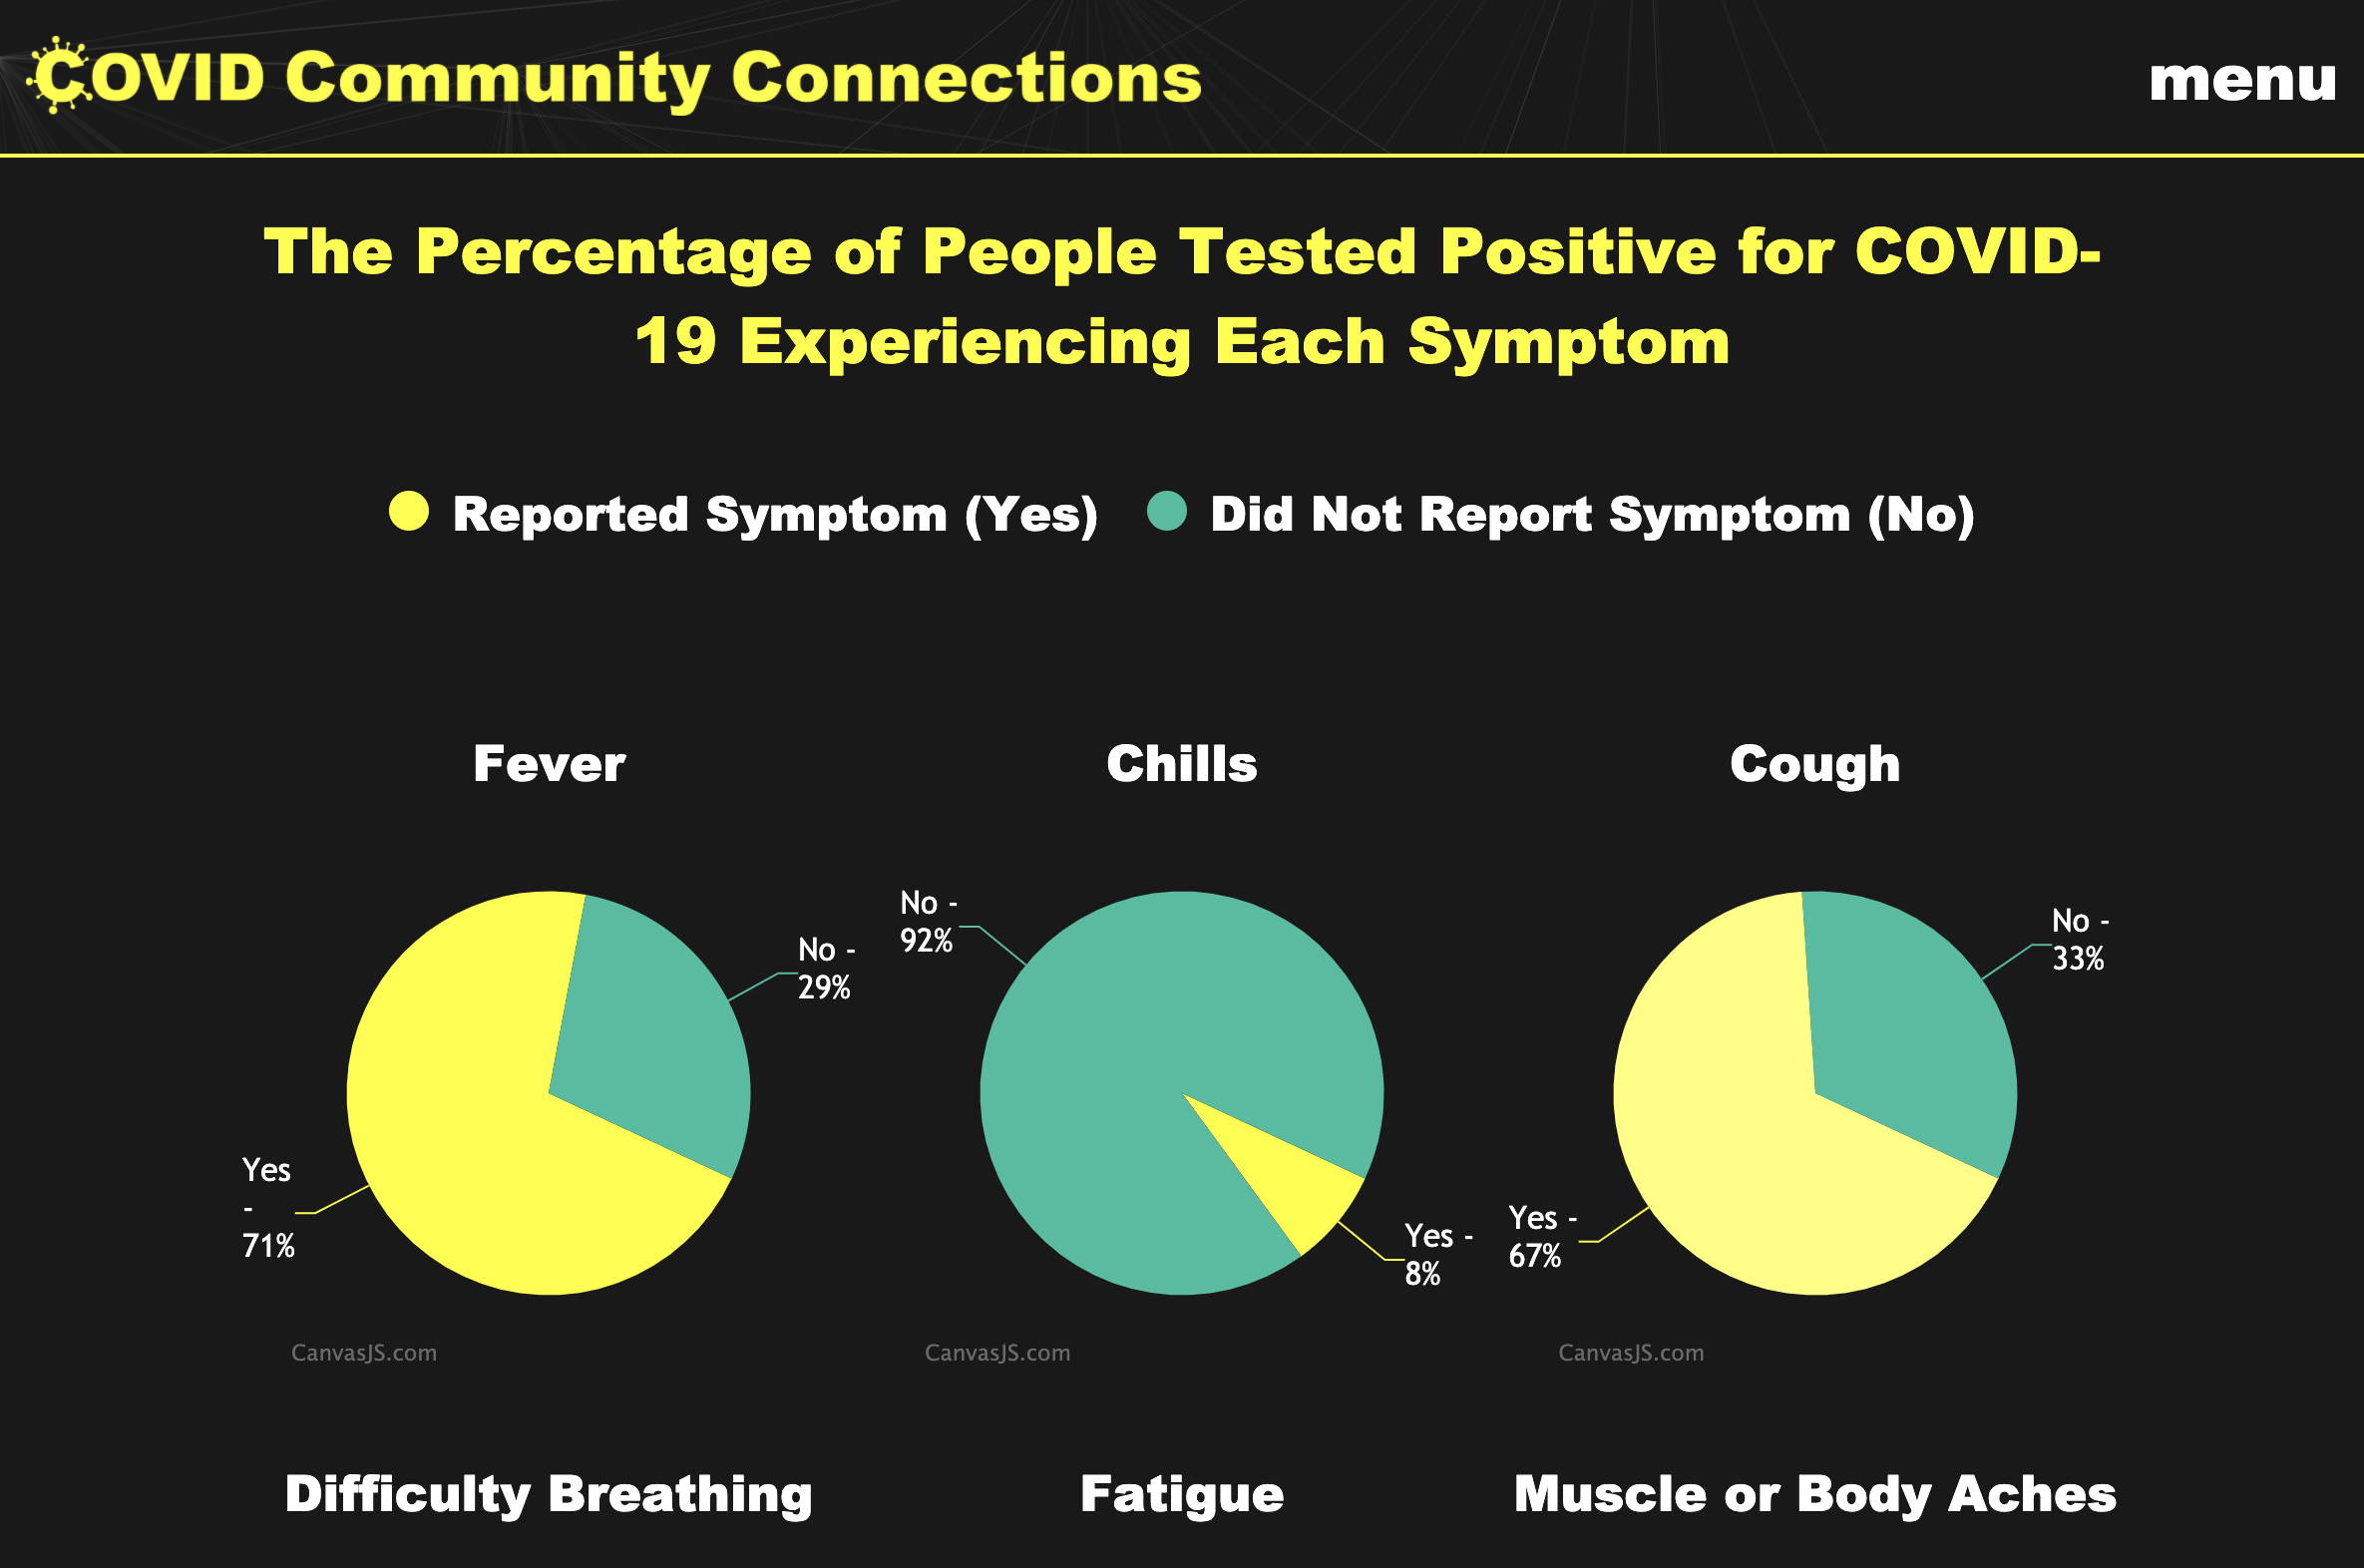
The Statistics page that includes graphs that illustrate the data collected by the forms.
-

Another type of graph on the Statistics page.
-

A clickable map showing up to date data on COVID-19 for each country.


Inspiration
When the world shut down in March 2020 due to the COVID-19 pandemic, no one had any answers for what lay ahead. Exacerbated social and economic problems only amplified the calls for help. From historic unemployment, to a greater reliance on food banks, to an increase in divorces, the coronavirus has taught us to lean on each other a little more at a distance and to be wary of fake news. With community spirit and a need for trustworthy news sources in mind, we decided to create a website from scratch addressing these two central issues.
While the world is on pause, so many of us are hopelessly scrolling through our news feeds from home. People are frantically trying to decipher what is true and what is false in these times of uncertainty. As a new pandemic, there are many blanks in our understanding of the virus leading to misconceptions and fear.
It can be lonely for those affected who are quarantining alone or who don’t know anyone else going through what they are. Our professionals don’t know everything about the coronavirus yet, so having people telling their stories can help others. In order to help our community, we want to provide a safe space where people who have been affected by COVID can share their experiences, connect, give tips and positive words. People’s inputs will then be translated into our statistics page to show the percentage of people that have had each symptom shown below.
The internet is filled with false information. We are here to demystify them to educate people and spread safety.
What it does
COVID Community Connections is a website that allows people to connect around the world by sharing their experiences with COVID-19. On the website, you can view other’s stories and read how their lives were impacted by the pandemic. You can also share your own story by filling out the form on the website.
COVID Community Connections is both a tool for connecting and a tool for educating. Aside from the Experiences feature, the data collected from the forms is also compiled into graphs on the Statistics page. This allows for people to see and interpret crowdsourced information about COVID-19 and its most common symptoms. Additionally, on the Information page, there is a clickable world map that displays up-to-date data relating to COVID-19 cases for every country. On this page, there is also a Fact Checker section that displays common misconceptions about the pandemic and offers credible sources and articles to educate people on the realities of COVID-19.
How we built it
The website was built with HTML, CSS, and JavaScript and most of the development was done on Glitch. We also made use of Google’s Firebase RealTime Database and an API for COVID-19 data. The p5.js library was also used to create the animations of the loading screen, which were recorded and put into a GIF and of the home page and headers, which are live and randomized sketches. Other tools and programs used include Photoshop and GitHub.
After deciding on an idea, we divided our tasks and spent the first day trying to complete as much as possible. By the end of the day, most of the UI was done, the database was created, and the graphs were added to the page. The second day was dedicated to connecting the database to the forms and graphs and fixing any bugs that came up. Also, this was when the UI was cleaned up and styling for the mobile website was made.
Challenges we ran into
Most of the challenges we ran into were related to using the database since we are fairly new to it. One of our bugs would be that the graphs on Statistics and the experiences on Experiences would only load and show after the page was refreshed for a second time. After reading through the code, we realized that the functions calling for the drawing of the graphs or showing of the experiences were being called before the appropriate data was being retrieved from the database. To fix this, we called these functions after getting what we needed from the database. Another problem we ran into was updating statistics information when a form was filled out because we were having difficulty with finding the right branches and using parse to be able to use the data how we wanted it to be used.
Accomplishments that we're proud of
We’re proud of the product of this weekend because it is the culmination all of the hard work, dedication and skills we’ve learned. To see it pay off as a tangible and deliverable project feels amazing, especially considering that we were able to complete it in one weekend. In particular, most of us have never worked with an api before and are pleased to have been able to integrate it smoothly into our interface.
What we learned
We learned a lot, not only about how to make a website and the many, many things required to build one, but also about how to work together as a team (especially during the hard times) and create something bigger than ourselves. Through every glitch and setback, we used our skills and each other to come out the other side.
On the technical side, we were excited to further our knowledge of Google Firebase as we have worked with it once before. We also got more comfortable with designing UIs and optimizing our code so that we can quickly adapt it should any change arise.
What's next for COVID Community Connections
Future plans for the website include adding a discussion forum where people can have conversations in real time and be able to reply to people’s Experiences. We would also like to add other language options to make Covid Community Connections more accessible.
Built With
- apis
- css
- firebase
- html
- javascript
- p5.js


Log in or sign up for Devpost to join the conversation.