-
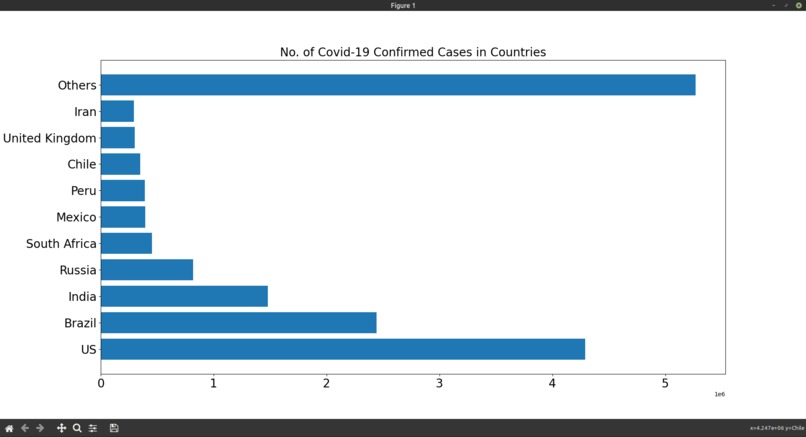
Bar Graph for Confirmed cases
-
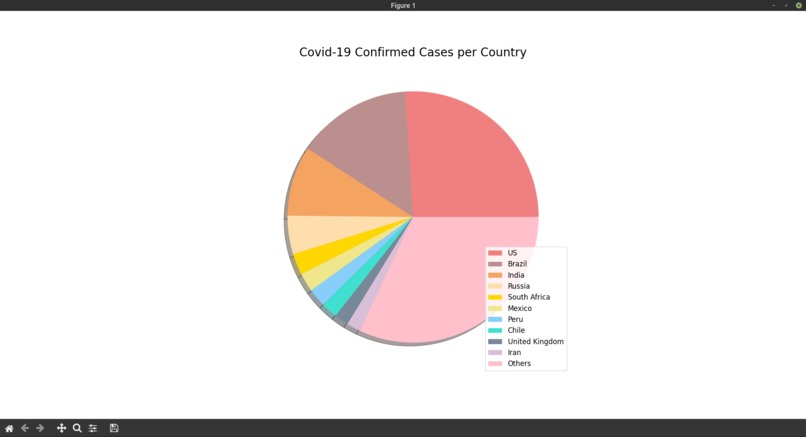
Pie Chart for Confirmed cases
-
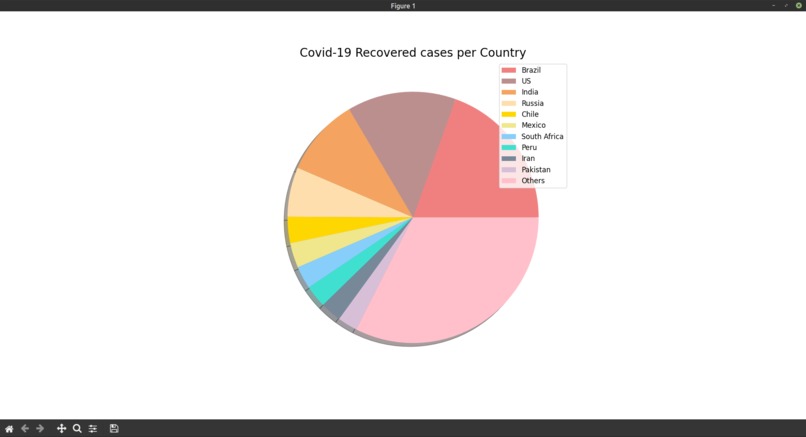
Pie chart for recovered cases


Inspiration
To provide a comparative view of confirmed covid cases, confirmed deaths, recovered cases and Active COVID cases across the world.
What it does
It provides a Visual representation of Confirmed, Deaths, Recovered and Active cases of COVID through Bar Graphs and Pie charts.
How I built it
- The dataset used from Kaggle - country_wise_data.csv
- I used the Python libraries - numpy, pandas, matplotlib.
- The dataset was read and the Top 10 countries with confirmed cases, deaths, recovered cases and active cases were sorted out, all the remaining countries' cases were added together and assigned to others.
- Then, a Bar graph and Pie chart were constructed using matplotliib for the sorted data.
What I learned
- How to sort data and organize it for graphs.
- Construct the pie chart using matplotlib.
What's next for COVID cases visualization
- We could connect it to a live dataset that will keep the Data Visualization up to date.
- We can also try to create a Machine Learning model to predict future COVID cases and deaths.

Log in or sign up for Devpost to join the conversation.