Inspiration
I've been building a mapping application for the last few years, then the crises started, so I pivoted to making a repository of reported cases in the US with data drawn from USAFacts
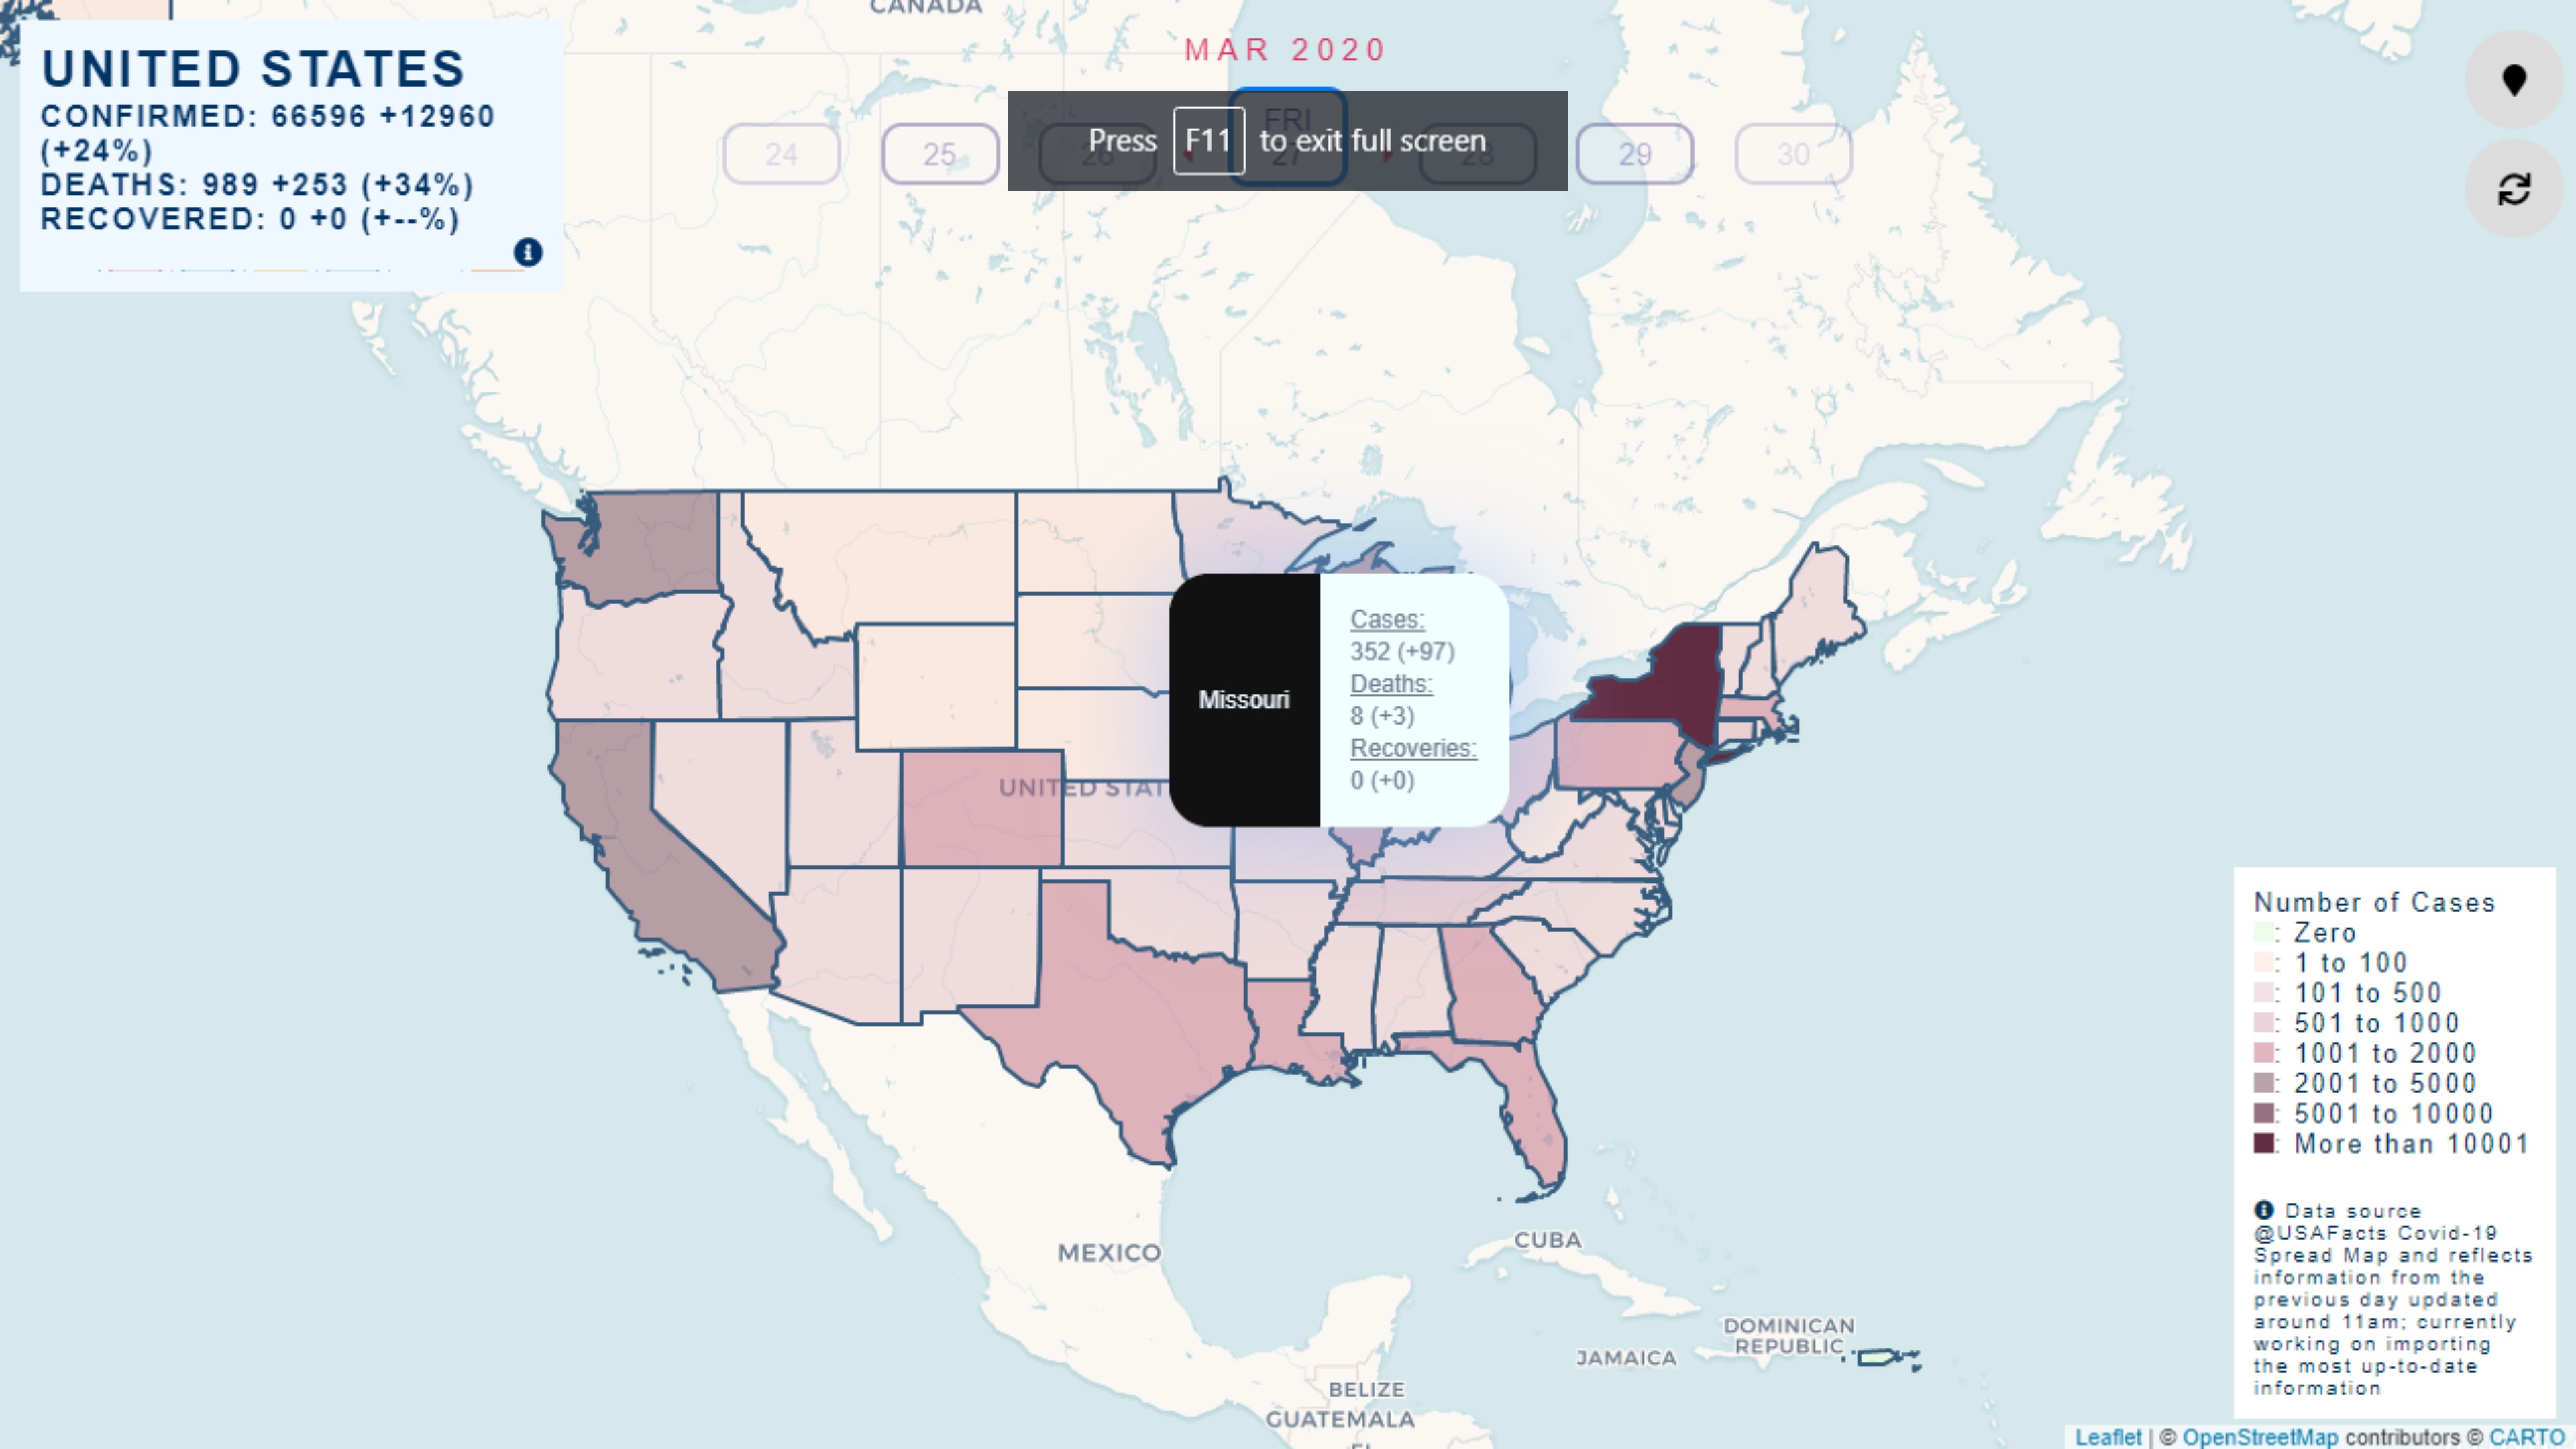
What it does
User friendly map showing covid cases in the US.
How I built it
Leaflet with vanilla JS front-end. Node + postgres backend
Challenges I ran into
Timing - my 2nd child was born and I code late into night.. cleaning data and working with the Polygon geoJson data - front to backend.
Accomplishments that I'm proud of
WIP
What I learned
Not done yet!
What's next for Covid Atlas
Lots left- 1. gathering and building module for accessing live data. 2. Building analytics - charting tools on top of current data. 3. Extend to other countries. 4. Creating infrastructure to incorporate local level user generated data points for things such as medical/testing facilities/ supply at local grocery stores / anonymized and private reports of users with symptoms, etc...


Log in or sign up for Devpost to join the conversation.