What it does
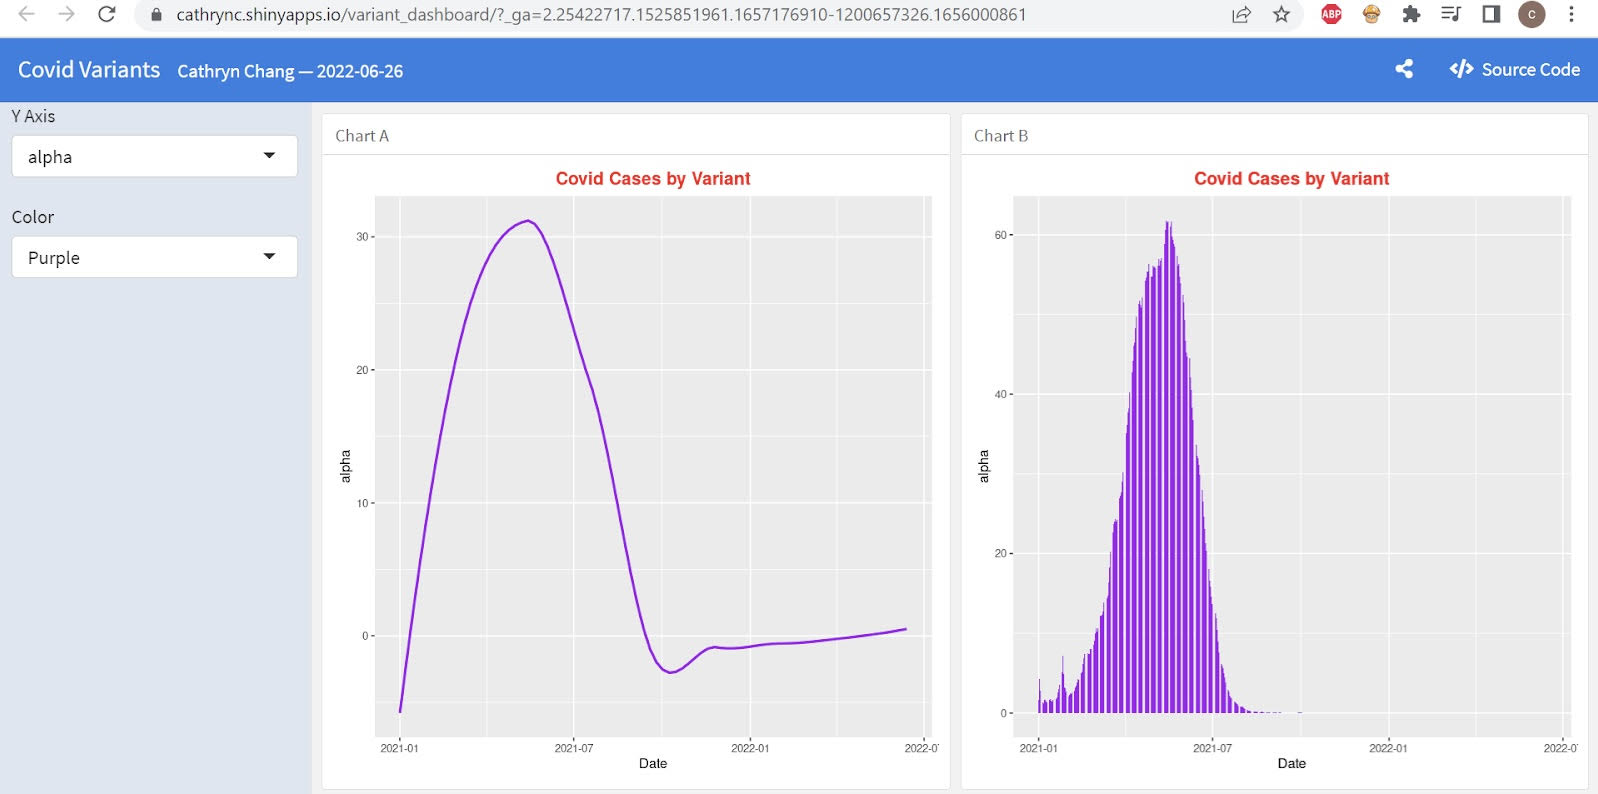
Displays Covid-19 cases by variant
How we built it
Used Covid-19 dataset from Github, programmed with R, and connected to Shiny to display interactive dashboard
Challenges we ran into
Had some trouble figuring out how to connect RStudio to Shiny
Accomplishments that we're proud of
Creating my first interactive data dashboard
What's next for Covid-19 Variant Dashboard
Displaying more graphs to better visualize the data

Log in or sign up for Devpost to join the conversation.