-
-
Homepage
-

Statistics
-
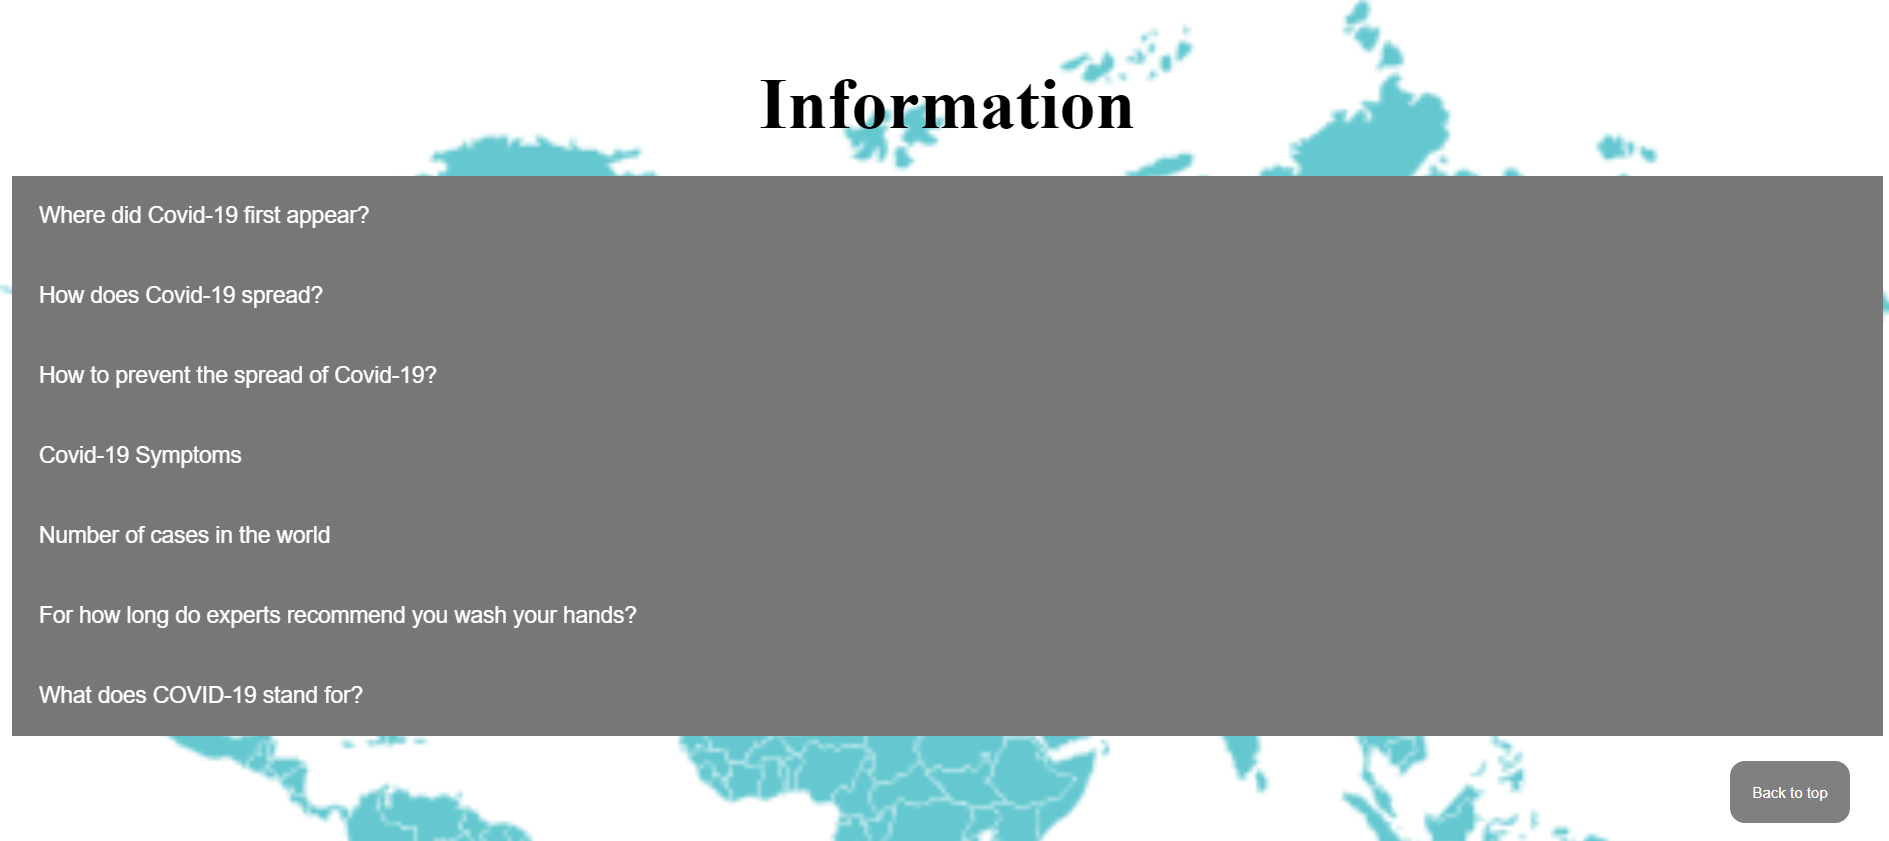
Information
-

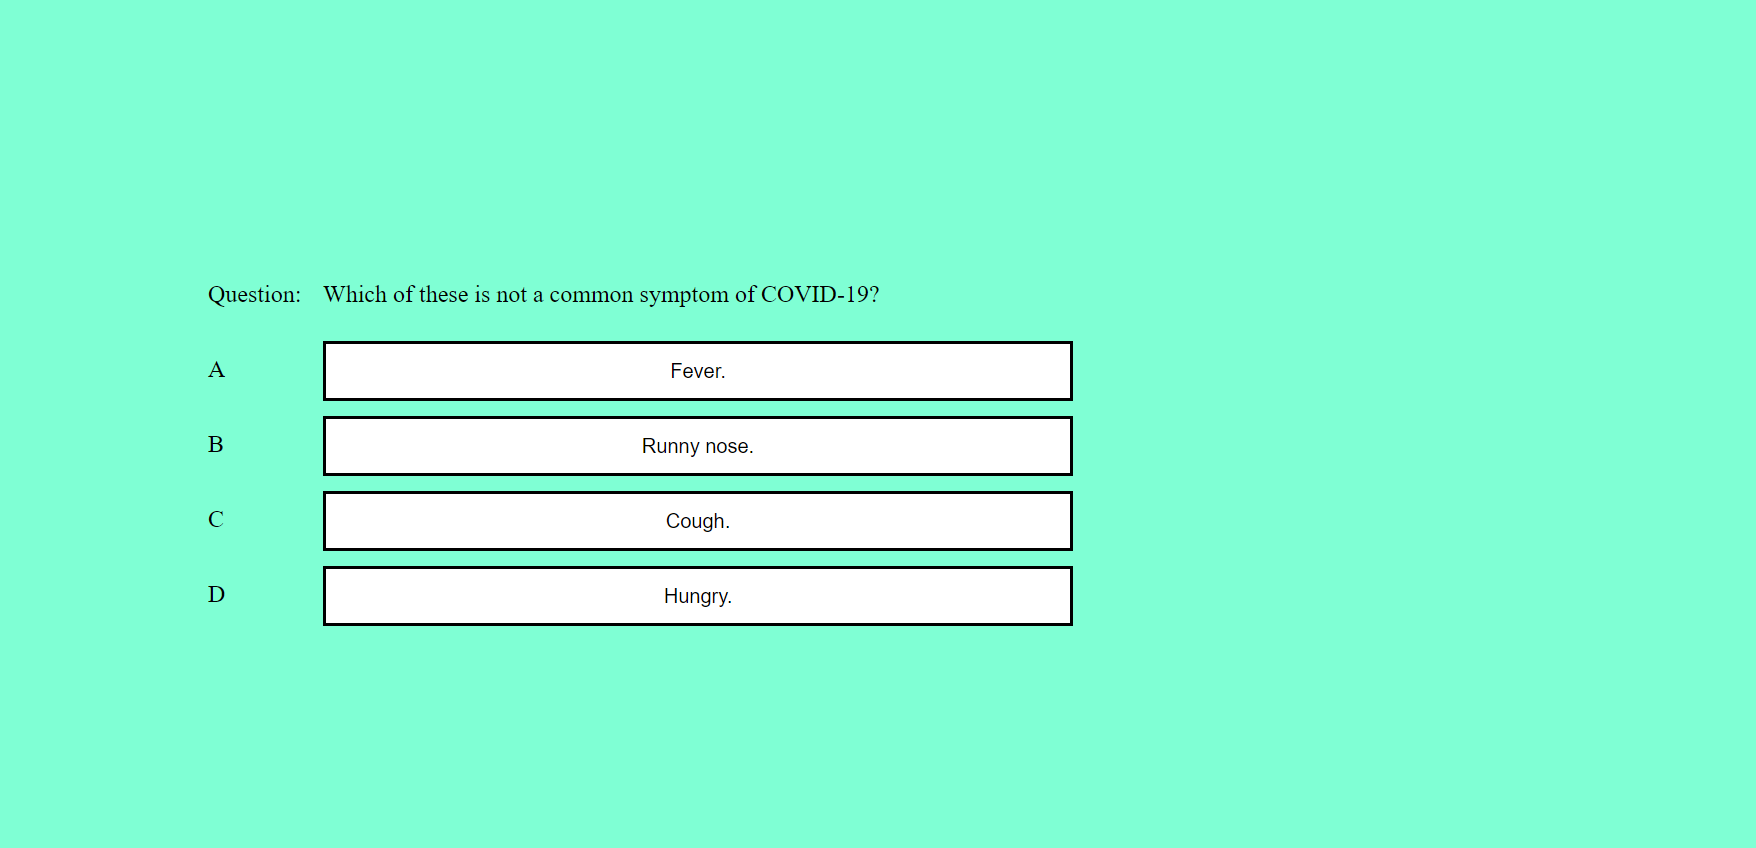
Quiz
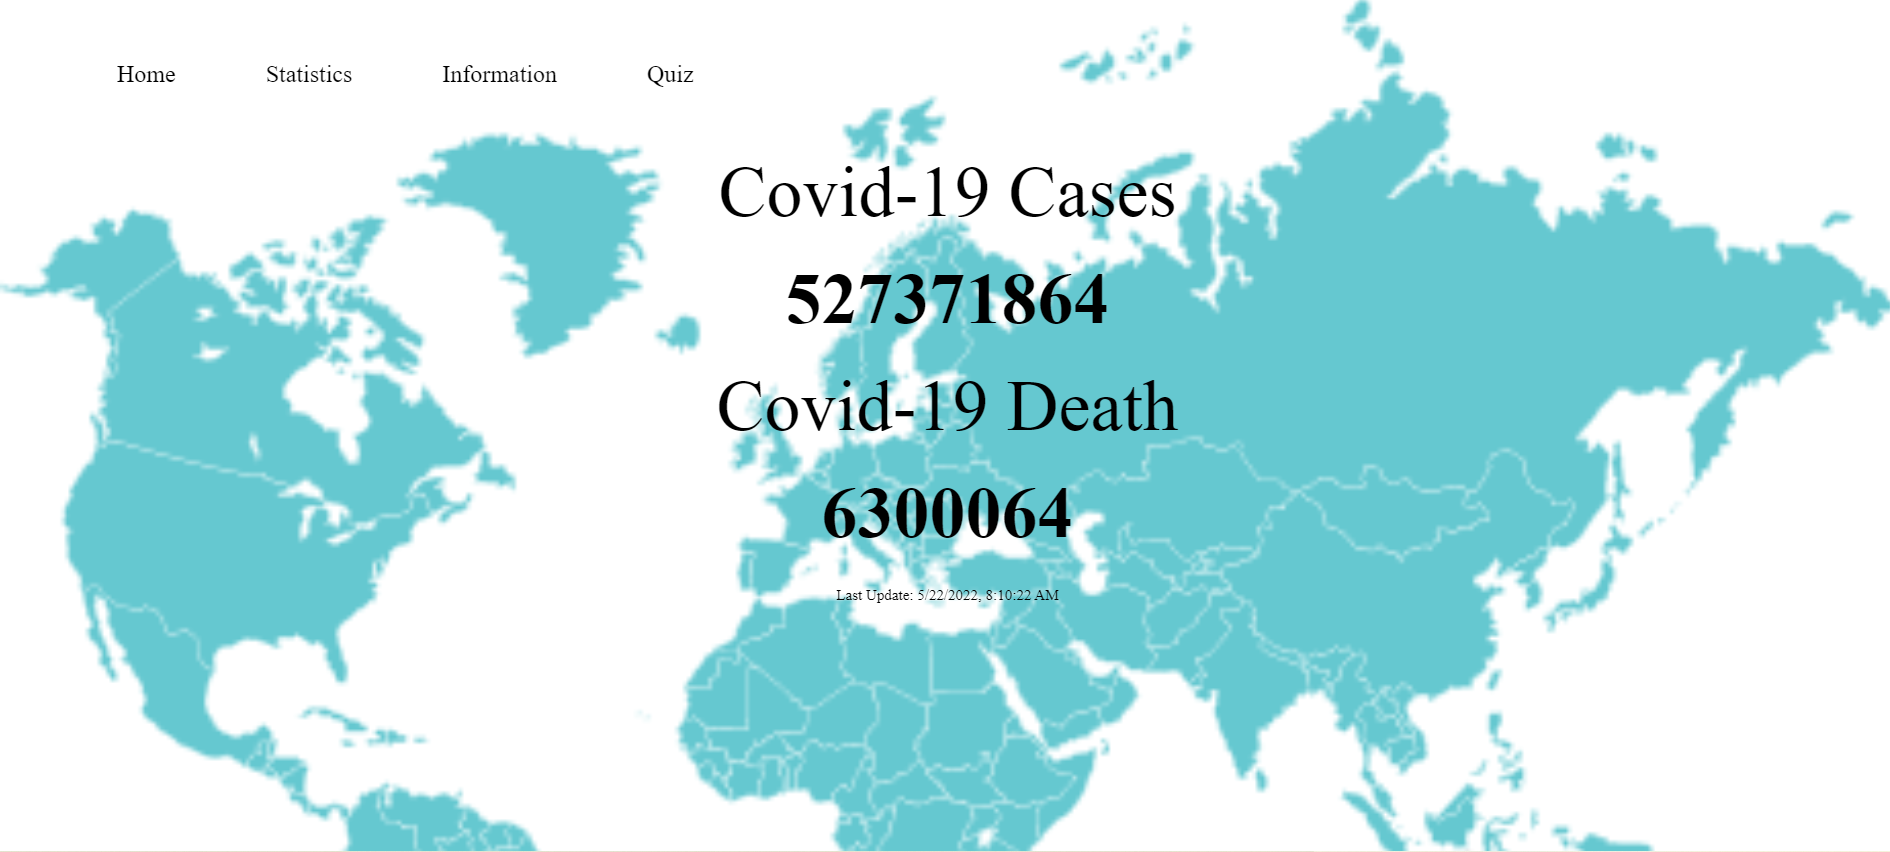
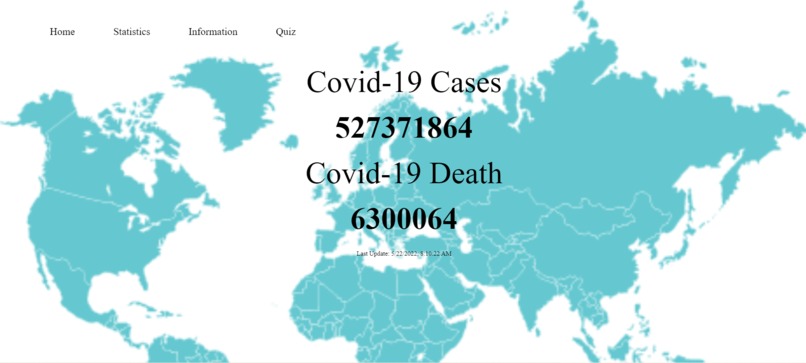
Covid-19 Statistics
Submission to Jamhacks' Jamhacks 6, 2022 by Haoen Shan and Yunzhe Qiao.
Inspiration
Nowadays, Covid-19 is happening all over the world. We were to make a convenient website access to the status of its exposure, with some knowledge about Covid-19.
What it does
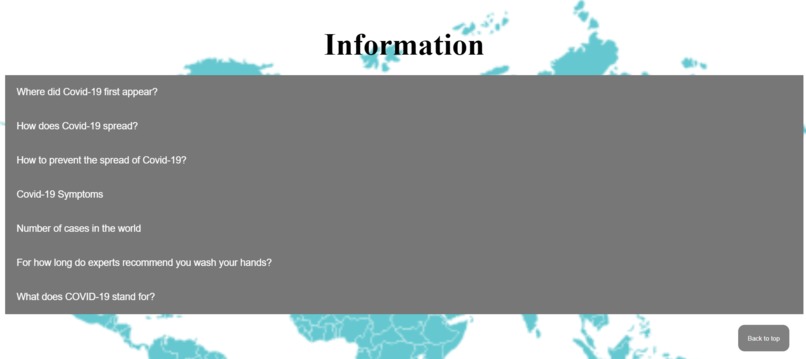
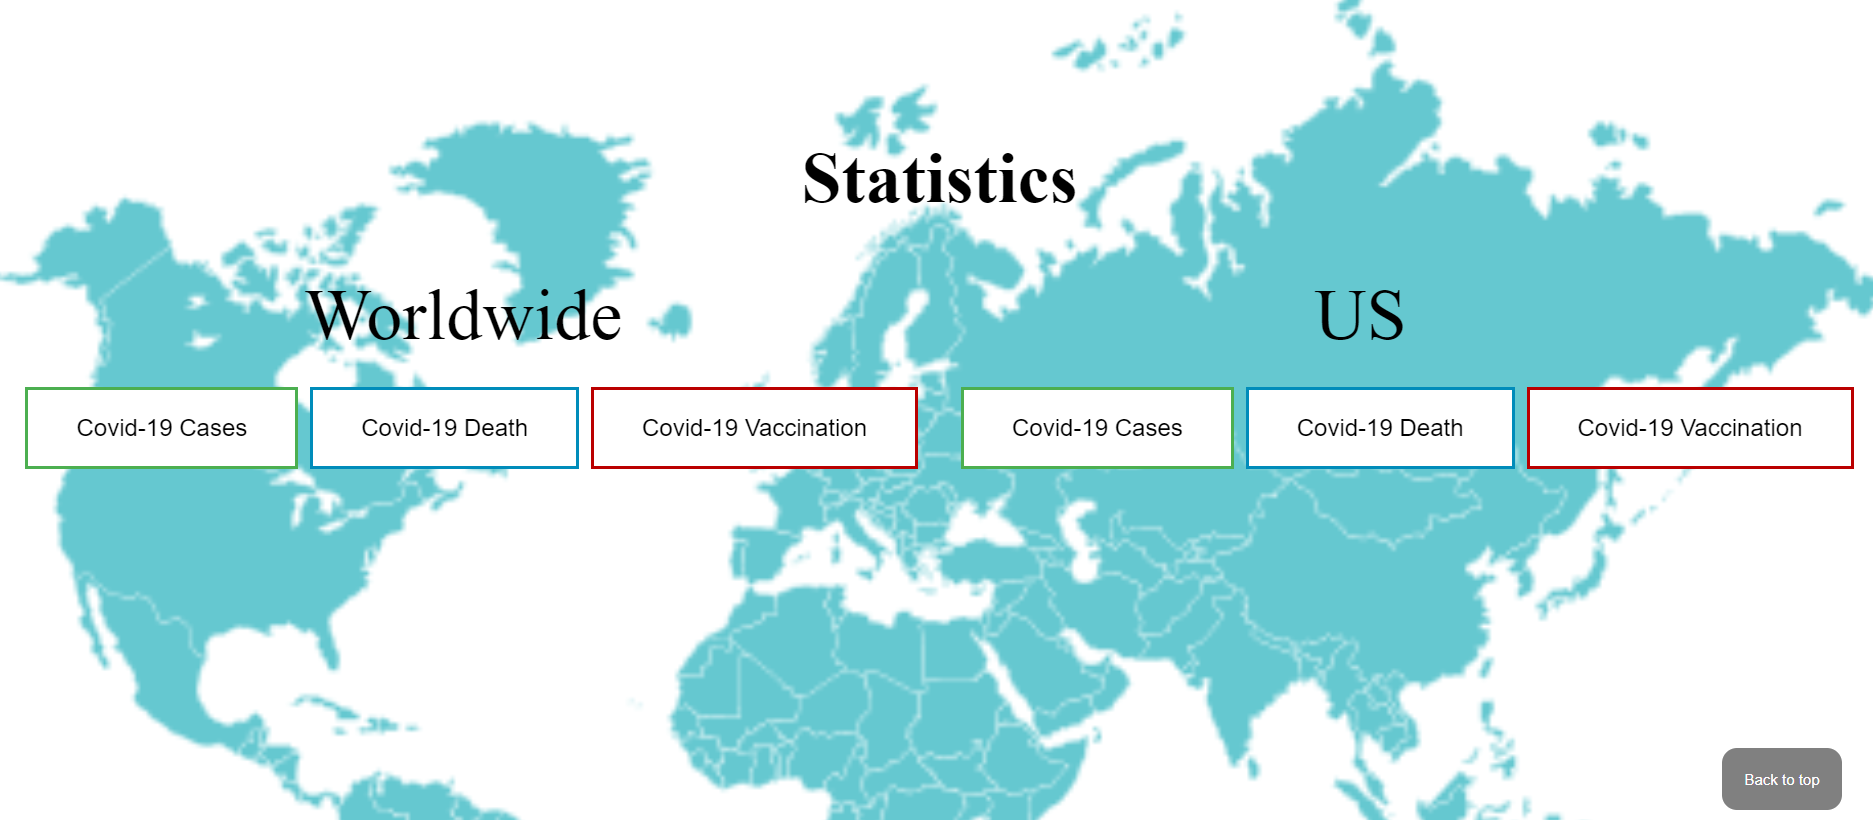
It collects the data, and clearly shows and interprets the infographics of cases, deaths, and vaccination from the US and worldwide aspects. It also provide some Covid-19 knowledge (e.g. How to prevent Covid-19? etc.).
How we built it
HTML as base, and use .json and .csv data API to access the real time data, and fetch them, graphing them out using JavaScript and Flourish. We use JavaScript and CSS to improve the appearance of web pages.
Challenges we ran into and how we solved it
The first challenge we ran into is how to make it real-time and keep on updating, and we use JavaScript to solved this challenge. The second challenge we met was how to make this website more interesting. We added some dynamic graphs, interactive user interfaces and some Covid-19 knowledge to make this website no longer monotonous.
Accomplishments that we're proud of
- Various graphs(e.g. pie chart, bar chart, line chart etc.) that clearly present the data.
- The interactive user interfaces that can give user knowledge about Covid-19.
- Dynamic data, we made most of the data keep on update.
What we learned
- Chart.js skills.
- HTML, JavaScript and CSS knowledge from basic to advanced.
- How to make the data be dynamically update.
- Besides the website building, we also learned some Covid-19 knowledge.
What's next for Covid-19 Statistics
Continue to track the status of it, until the pandemic has ended. The website will help people to understand the situations we are facing now, and what we should do next to prevent the Covid-19. We will also add more features that can help people or make people more convenient, and some data analysis.


Log in or sign up for Devpost to join the conversation.