
Inspiration
Our inspiration for the project came from our analysis of the data, our personal experiences with making healthcare decisions during the pandemic, and our desire to make a difference in minimizing the challenges of decision making regarding state restrictions.
What it does
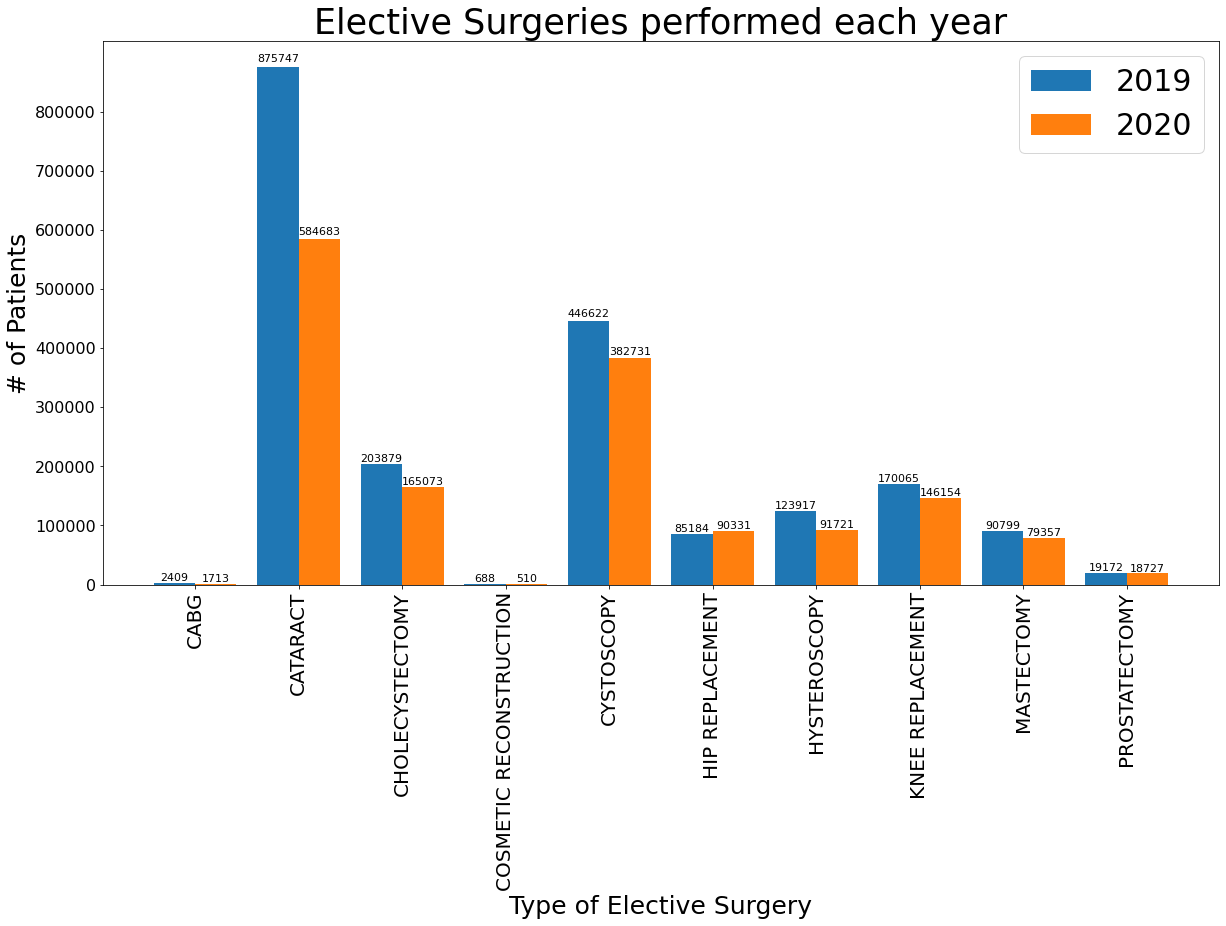
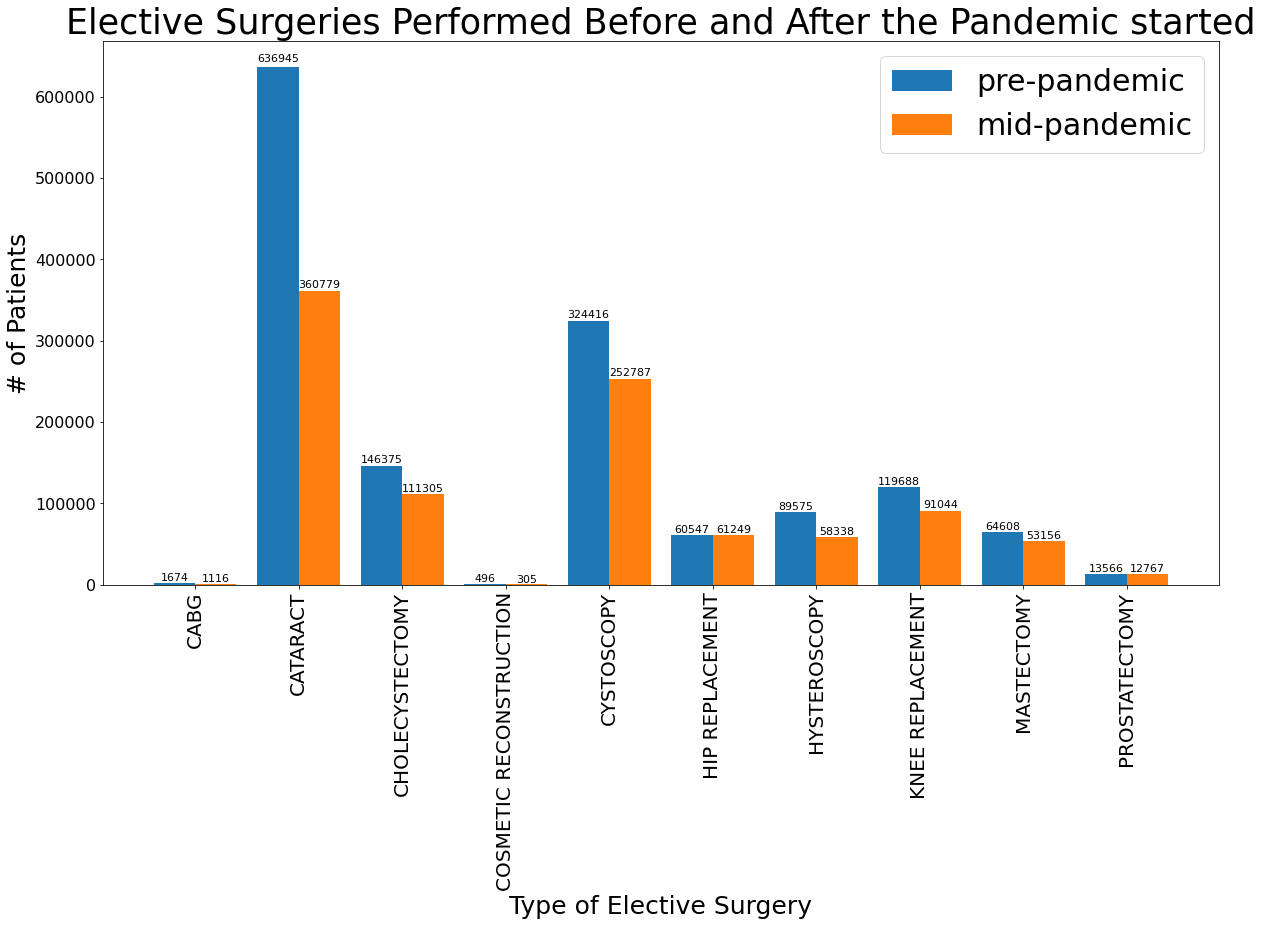
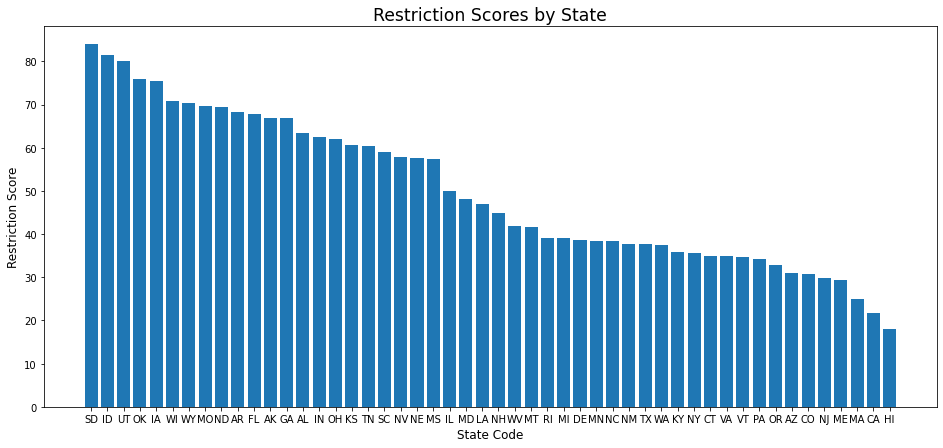
Our app provides a visual perspective on current state restriction levels and restriction levels that will minimize new COVID-19 cases and minimize the impact on elective surgery.
How we built it
Our team analyzed the existing data sets and used that analysis to find a "sweet spot" in the balance between minimizing new COVID-19 cases and minimizing the impact on elective surgery. We used a web application built using HTML, CSS, JS to display the restriction levels.
Challenges we ran into
One of our teammates left our group. For our next go around as a group we have to have more communication. Communicating is paramount when building anything. Even though this was a minor speed bump we pulled through and came out with a win.
Accomplishments that we're proud of
We created an application in 1 1/2 days. For some team members this was a first hackathon and it was a great learning experience.
What we learned
We learned a lot about how to work together, communicate, and divide up work based on individual strengths.
What's next for COVID-19 State Restrictions Advisor
Due to time constraints our app currently only is a demo for potential data for the state of Alabama so we would like to include the most current data for all 50 states. Ideally we would like to include a way for our app to reflect the most current data by scraping data quarterly. We would also like to explore opportunities to make our code more efficient.
Built With
- css
- html
- javascript
- jupyter
- python


Log in or sign up for Devpost to join the conversation.