-
-
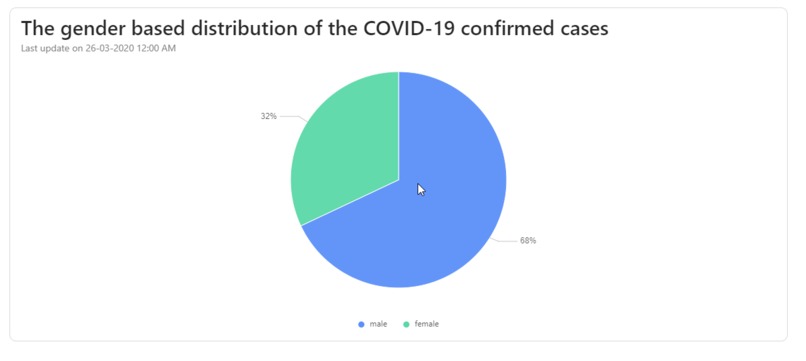
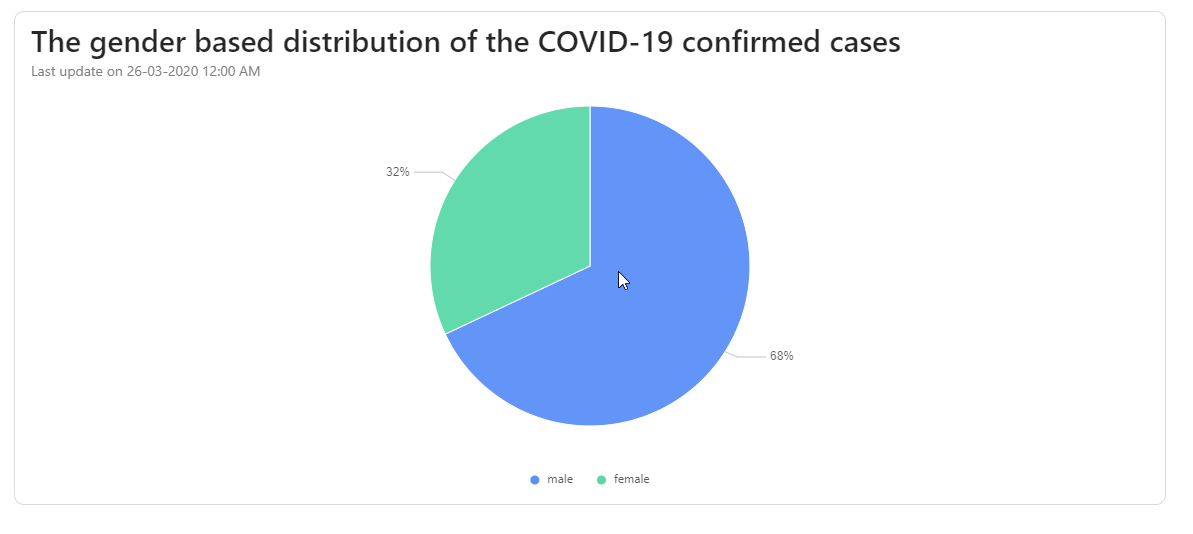
The gender based view of the confirmed patients
-
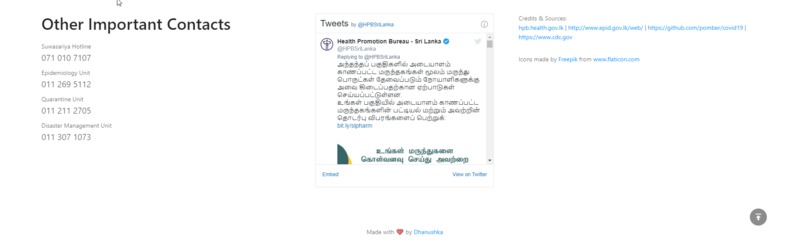
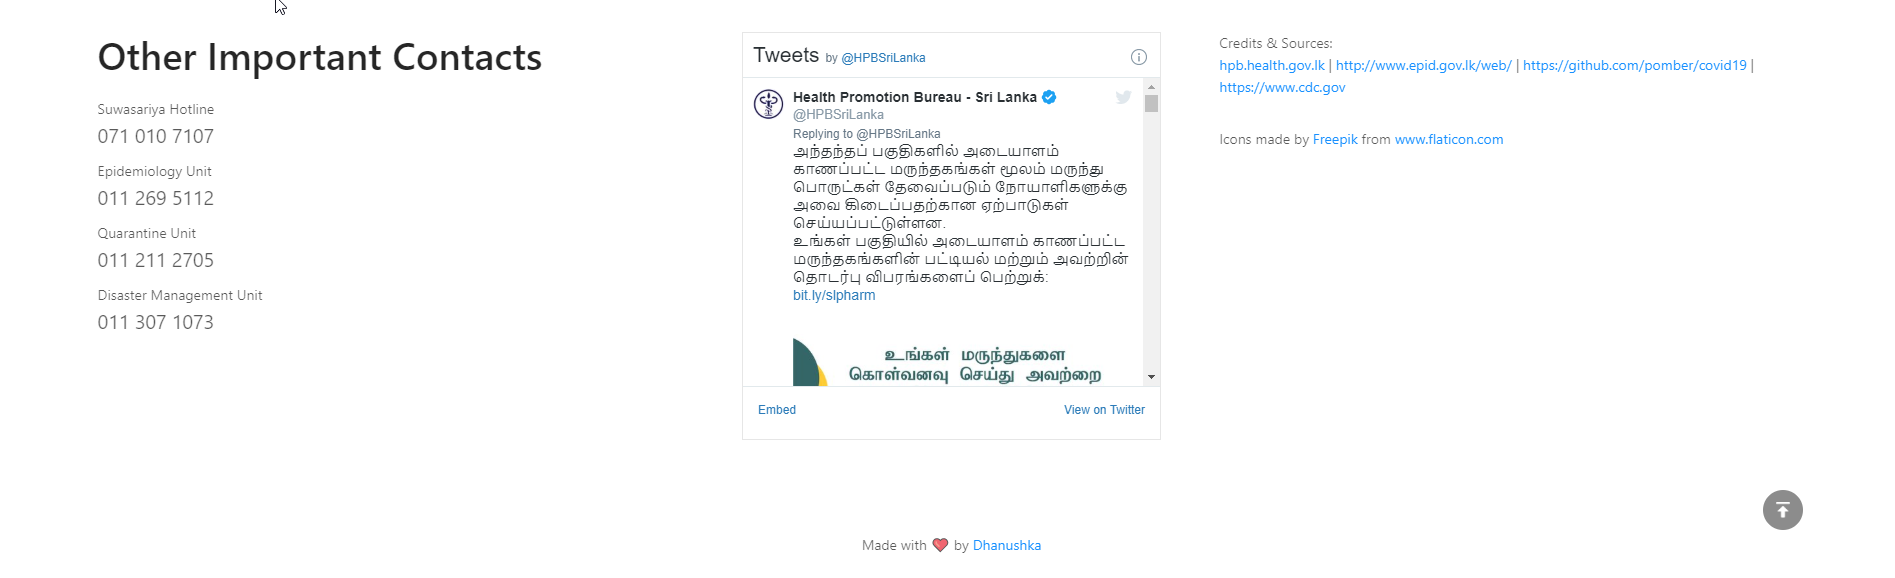
The important contact details and credit details
-
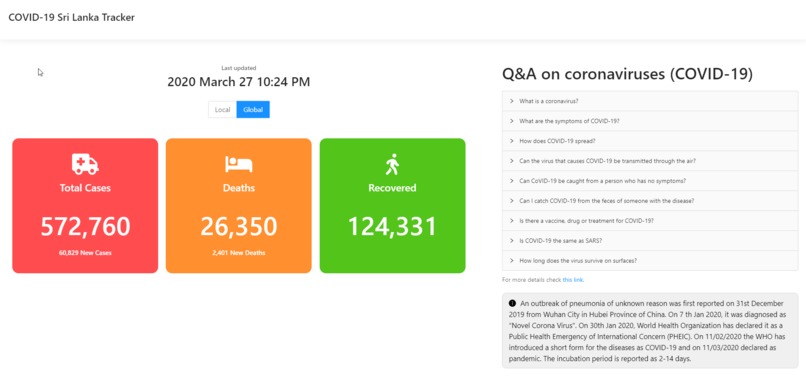
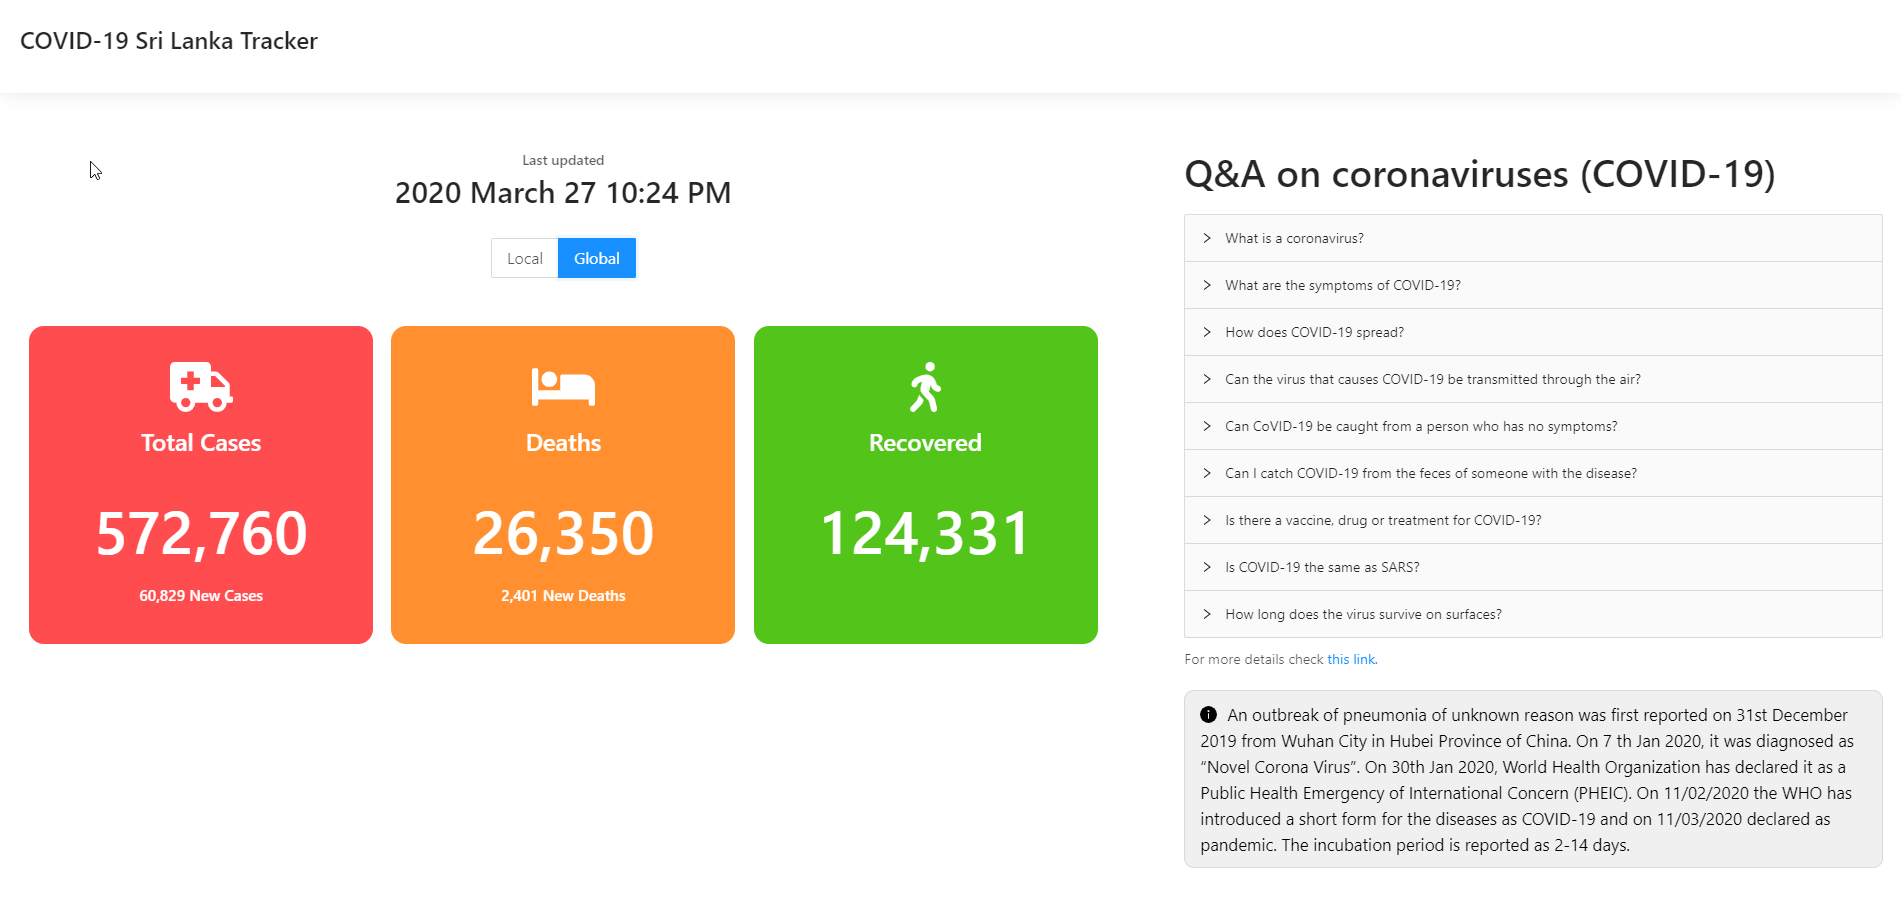
The total cases, deaths and recovered counts and Q&A panel
-
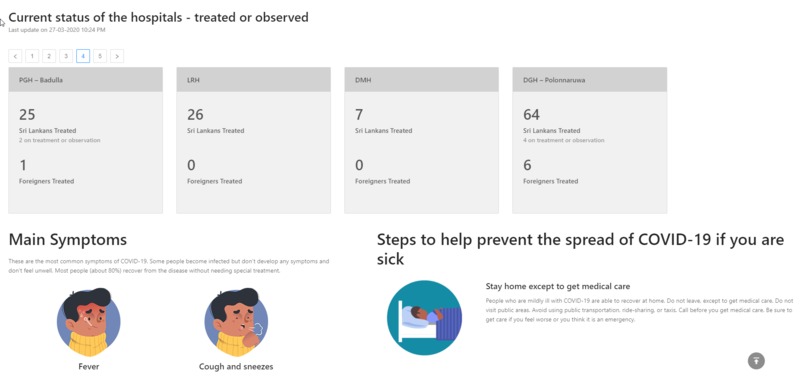
The current status of the hospitals
-
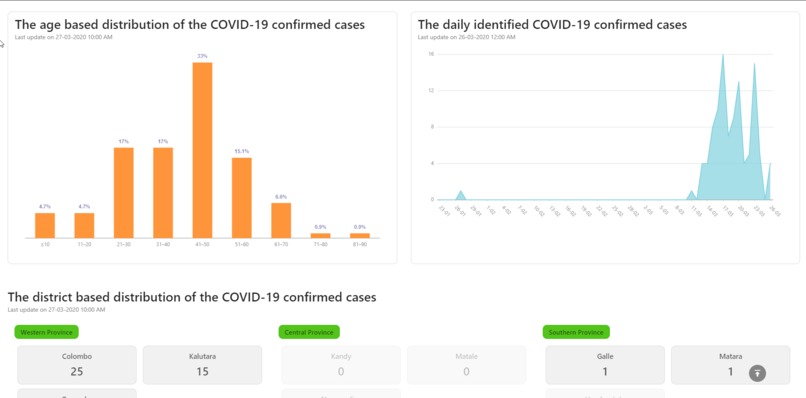
The age based distribution and the patient count recorded by each day charts
-
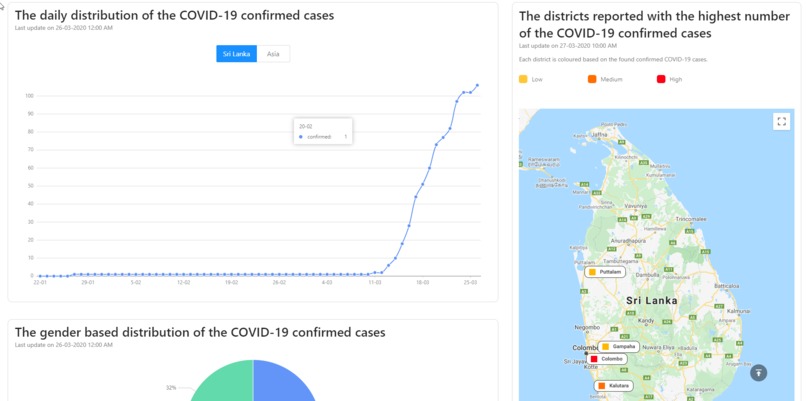
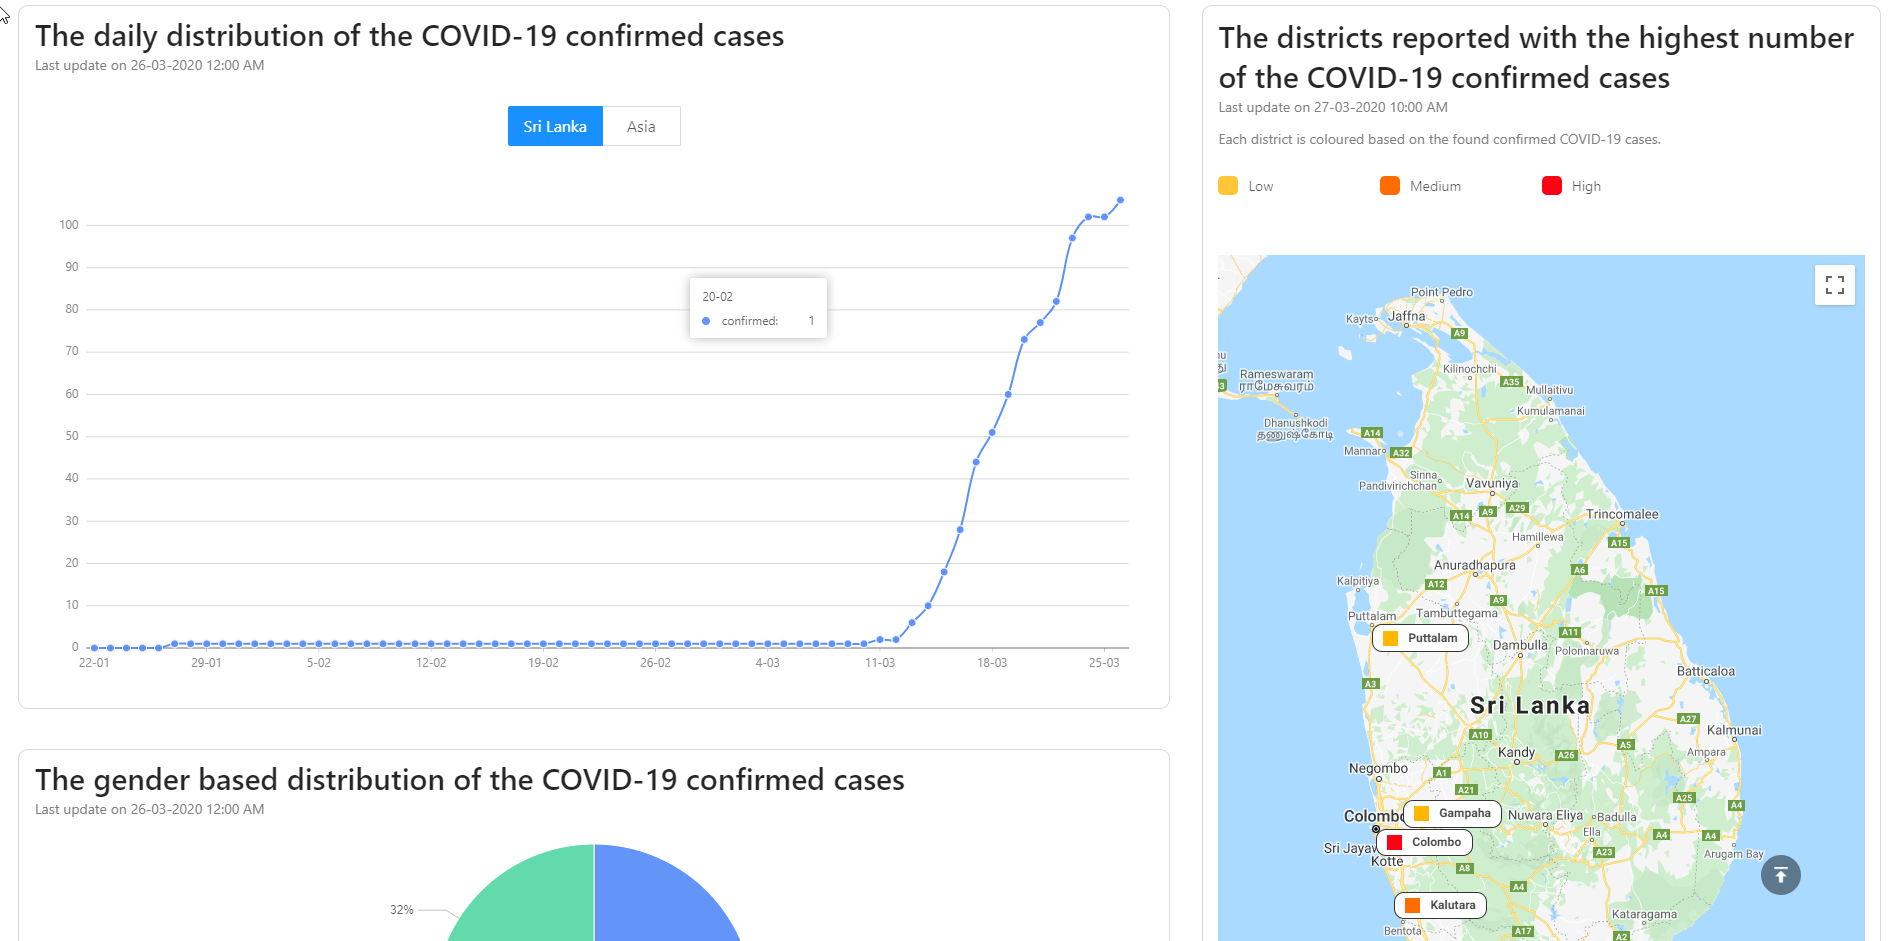
The daily distribution of confirmed cases chart and the map of highly affected areas


Inspiration
The first case of my country, Sri Lanka is reported on the 22nd of January. It got solved because the patient is cured and left the hospital. Later we found another case on 11th March. Then the situation got a little worse and we were founding patients each day. The government released an API to get the current total cases, deaths and recovered data including hospital data. When I saw this I should come up with the solution then people can get a better insight about how things going on Sri Lanka.
What it does
It is a dashboard solution which provides an in-depth analysis of the current status of the country.
How I built it
I used ReactJS as the Application framework and ant design as the UI framework. I have used netlify to host this.
Challenges I ran into
The initial problem was the data given from the government API is enough to provide better insight. But with this thought, I started implementing a released version 01. After that, I wanted to add more details. I found that time series API available out there. I have used it. I noticed that the epidemiology unit is publishing daily PDF files about the details based on the country. I wrote an API to read the PDF each day and extract the valuable information from it and send back to the user. This is the hardest part of this application. I had to spend an extra amount of time thinking about the UI look and feel since this is a dashboard solution I wanted to make it clean and concise.
Accomplishments that I'm proud of
I am proud about that I finally made it live. That is the best thing. I implemented this new API to read the PDF and extract the data. I have successfully hosted my application on the server. I have got lots of positive vibes after I put it on social media. I posted it in several groups as well.
What I learned
I have learned about the UI designing mechanism for the dashboards, I have improved my React knowledge and the usage of Ant Design. I haven't worked with Netlify because. So it was also a new thing I have learned during the work. I learned to write Node API as well and how to overcome issues when deploying it to the server.
What's next for COVID-19 Sri Lanka Tracker
Next, I am thinking of adding more features to improve awareness about how to avoid this COVID-19. My country is now partially lockdown. If this continues people will start running out of food and daily needs. The government and some other people started delivering the goods to doorstep. I am planning to add the places to contact each service such as Vegetables, Fruits, Milk and meat Items. Then people will be able to find those things easily and It will help to continue their life in a smoother way during the upcoming days with COVID-19.
Built With
- antd
- apis
- netlify
- react


Log in or sign up for Devpost to join the conversation.