-
-
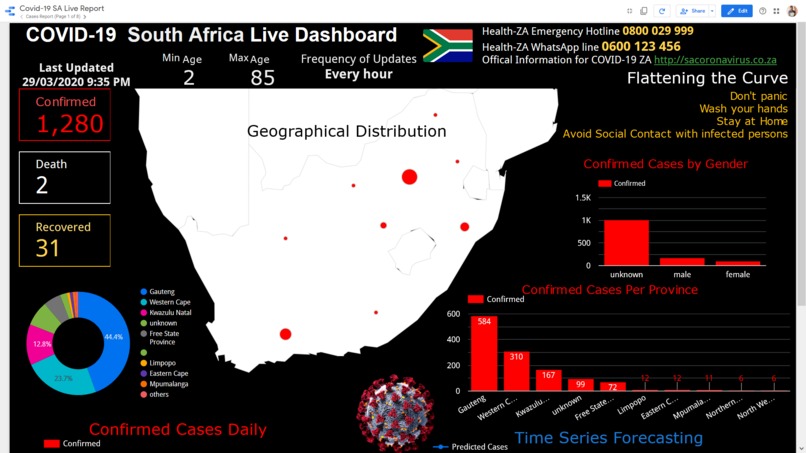
Covid-19 SA Live dashboard

What inspired us
When there is a problem ,we always see an opportunity to solve it and help our people
Whats our idea?
The dashboard track the number of confirmed cases,death cases,recovery cases and high risk provinces.
How you built it
We collected data manually from Department of Health Statements,Explore the data with python for data analysis and understanding of the data.Visualized the data in tableau to perform time series forecasting,view the high risk areas with geo maps,comparison of provinces/areas ,Gender Breakdown and created a Data Story.We then used Google Data Studio for reporting by making a dashboard that can be understood by a primary school child.
Challenges you faced
Its mot easy to get the data on time.Sometimes the stats is released early in the morning/late in the evening so we are always on alert.We check the stats every hour whether its released or not.
Accomplishments that we're proud of
We are proud that we are able to inform the nation on the progress of the viruson how it is spreading.Everyone can understand the dashboard and also proud to be part of this hackathon
What we learned
We have learned that the people need a reliable information that they can interpret and understand so that they can be able to take precautionary measures in order to protect themselves from the Virus.
What's next for Covid-19 SA Live dashboard
We want to convert the dashboard in the form of a web App so that it can be mobile friendly with a proper a link.


Log in or sign up for Devpost to join the conversation.