-
-
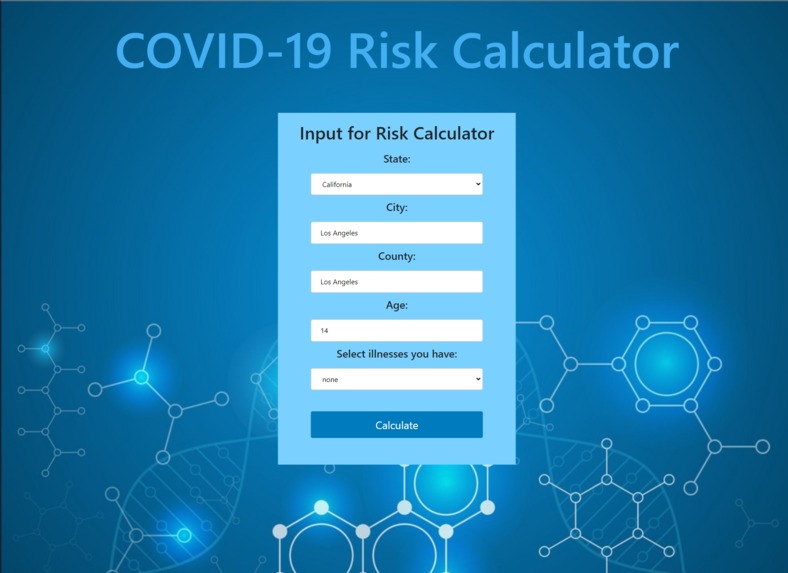
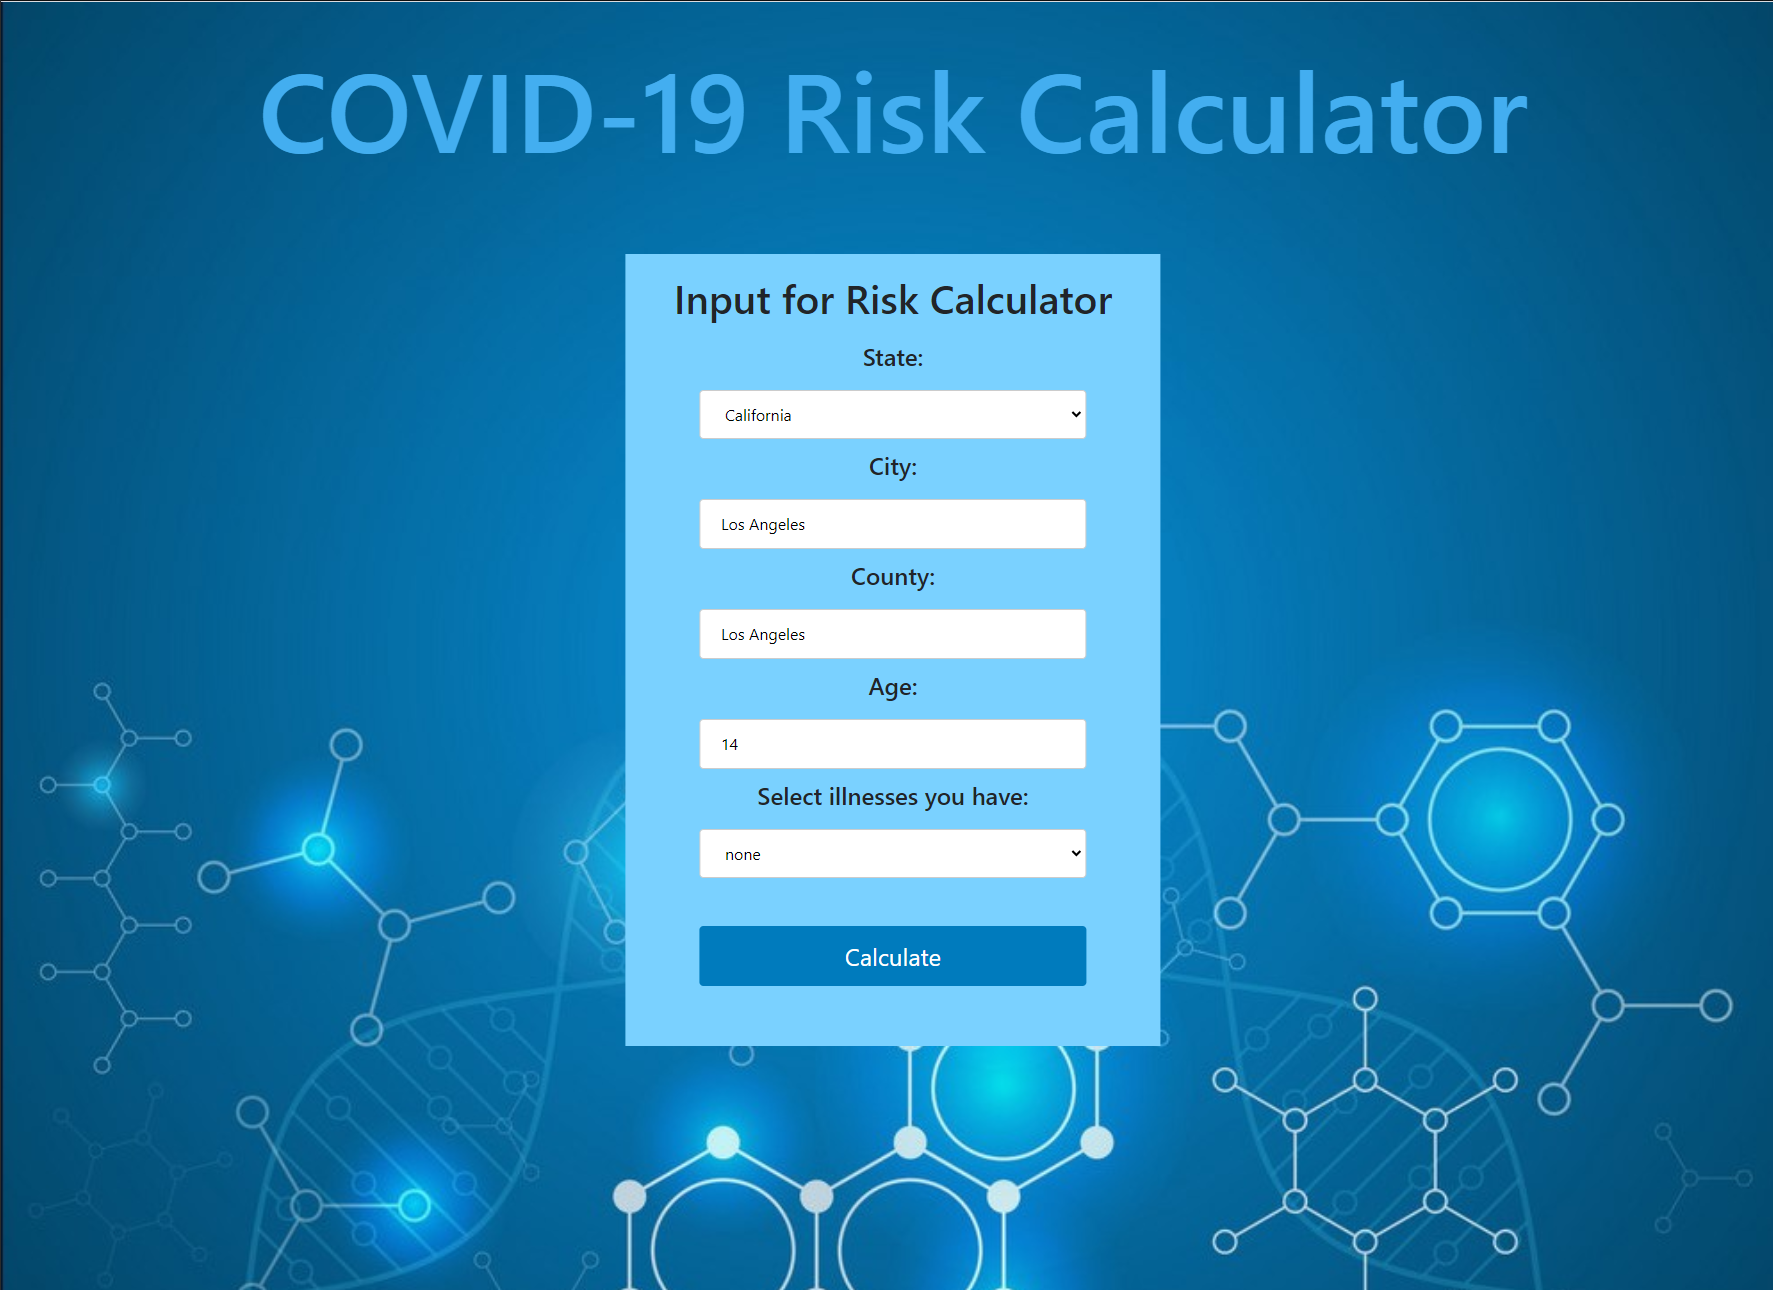
Front Page Form
-
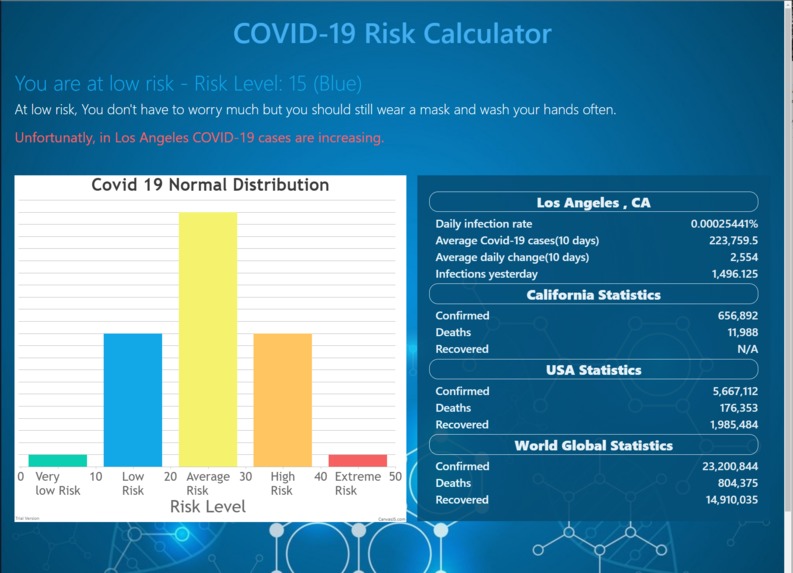
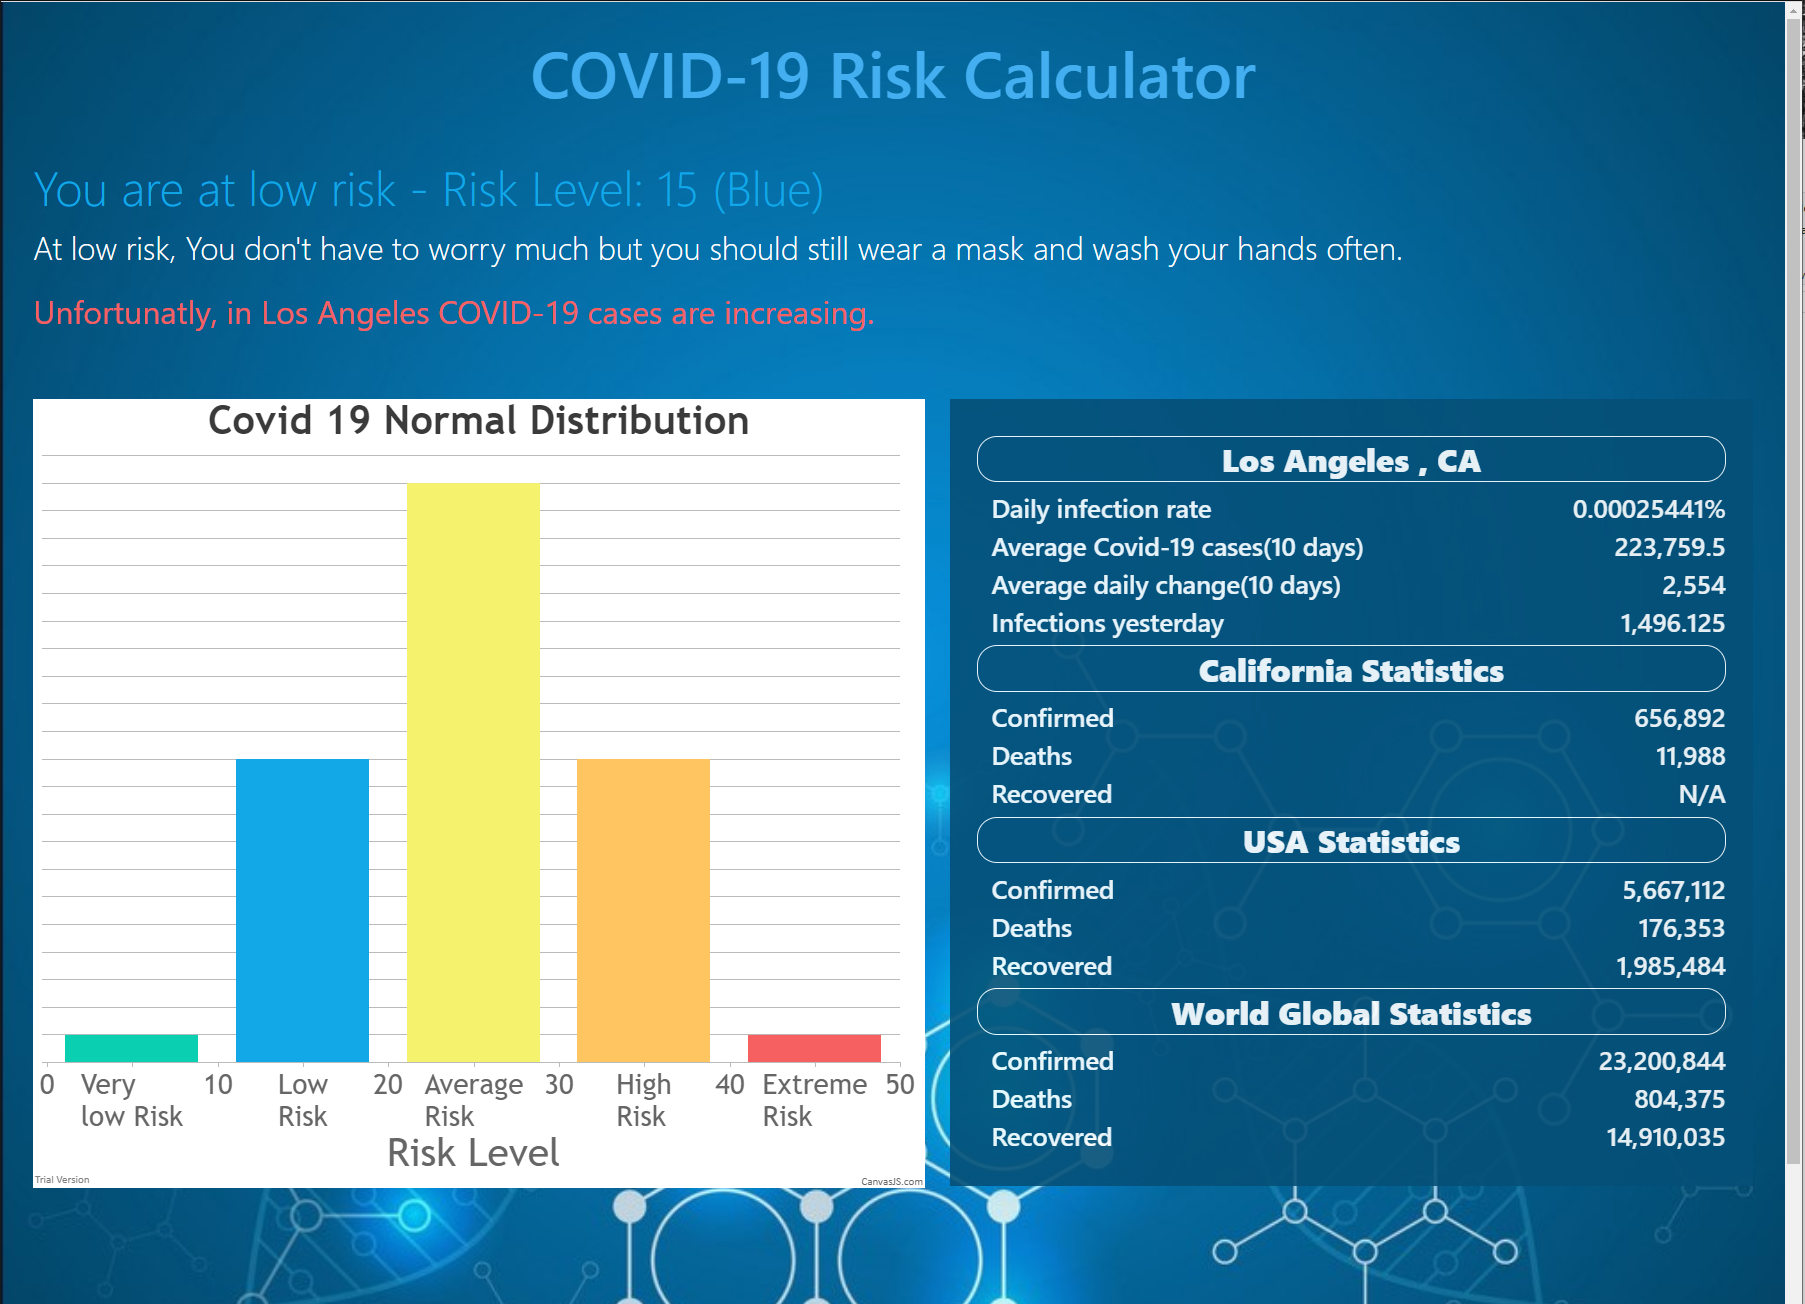
Results
COVID-19-Risk-Calculator
Submission for NHacks 2020
Inspiration
Coronavirus causes a lot of panic and damage. But is the panic really necessary for you?
How I built it
Using multiple APIs I am able to get COVID-19 data in your City/County. I also get population data and more. Then using a risk Model I built I am able to take this data and come out with a single risk value, and some metrics. You will be able to see your risk level and what you should do to stay safe. There is also a normal distribution graph where you are able to see where your risk level stands compared with other people. You will also be able to see data about your County like daily infection rate (%) and statistics about your State, Country, and World Global.
What it does
With the COVID-19 Risk Calculator, you are able to find out how risky COVID-19 if for you. With just a few questions (County, City, Age, Illnesses) this Calculator will tell you your risks and what you should do to stay safe.
Challenges I ran into
The biggest challenge was having to research and find relevant information about the Coronavirus.
The takeaway
In the process of building, I had to integrate multiple libraries and APIs of which I had no experience. Overall it was a good learning experience because we had such a small time frame it was interesting to plan out a project in a small period of time.
Contact me at denniszax32@gmail.com
Built With
- api.covid19api
- api.covidtracking
- canvas.js
- css
- geodb-free-service-api
- html
- javascript
- papaparse

Log in or sign up for Devpost to join the conversation.