-
-

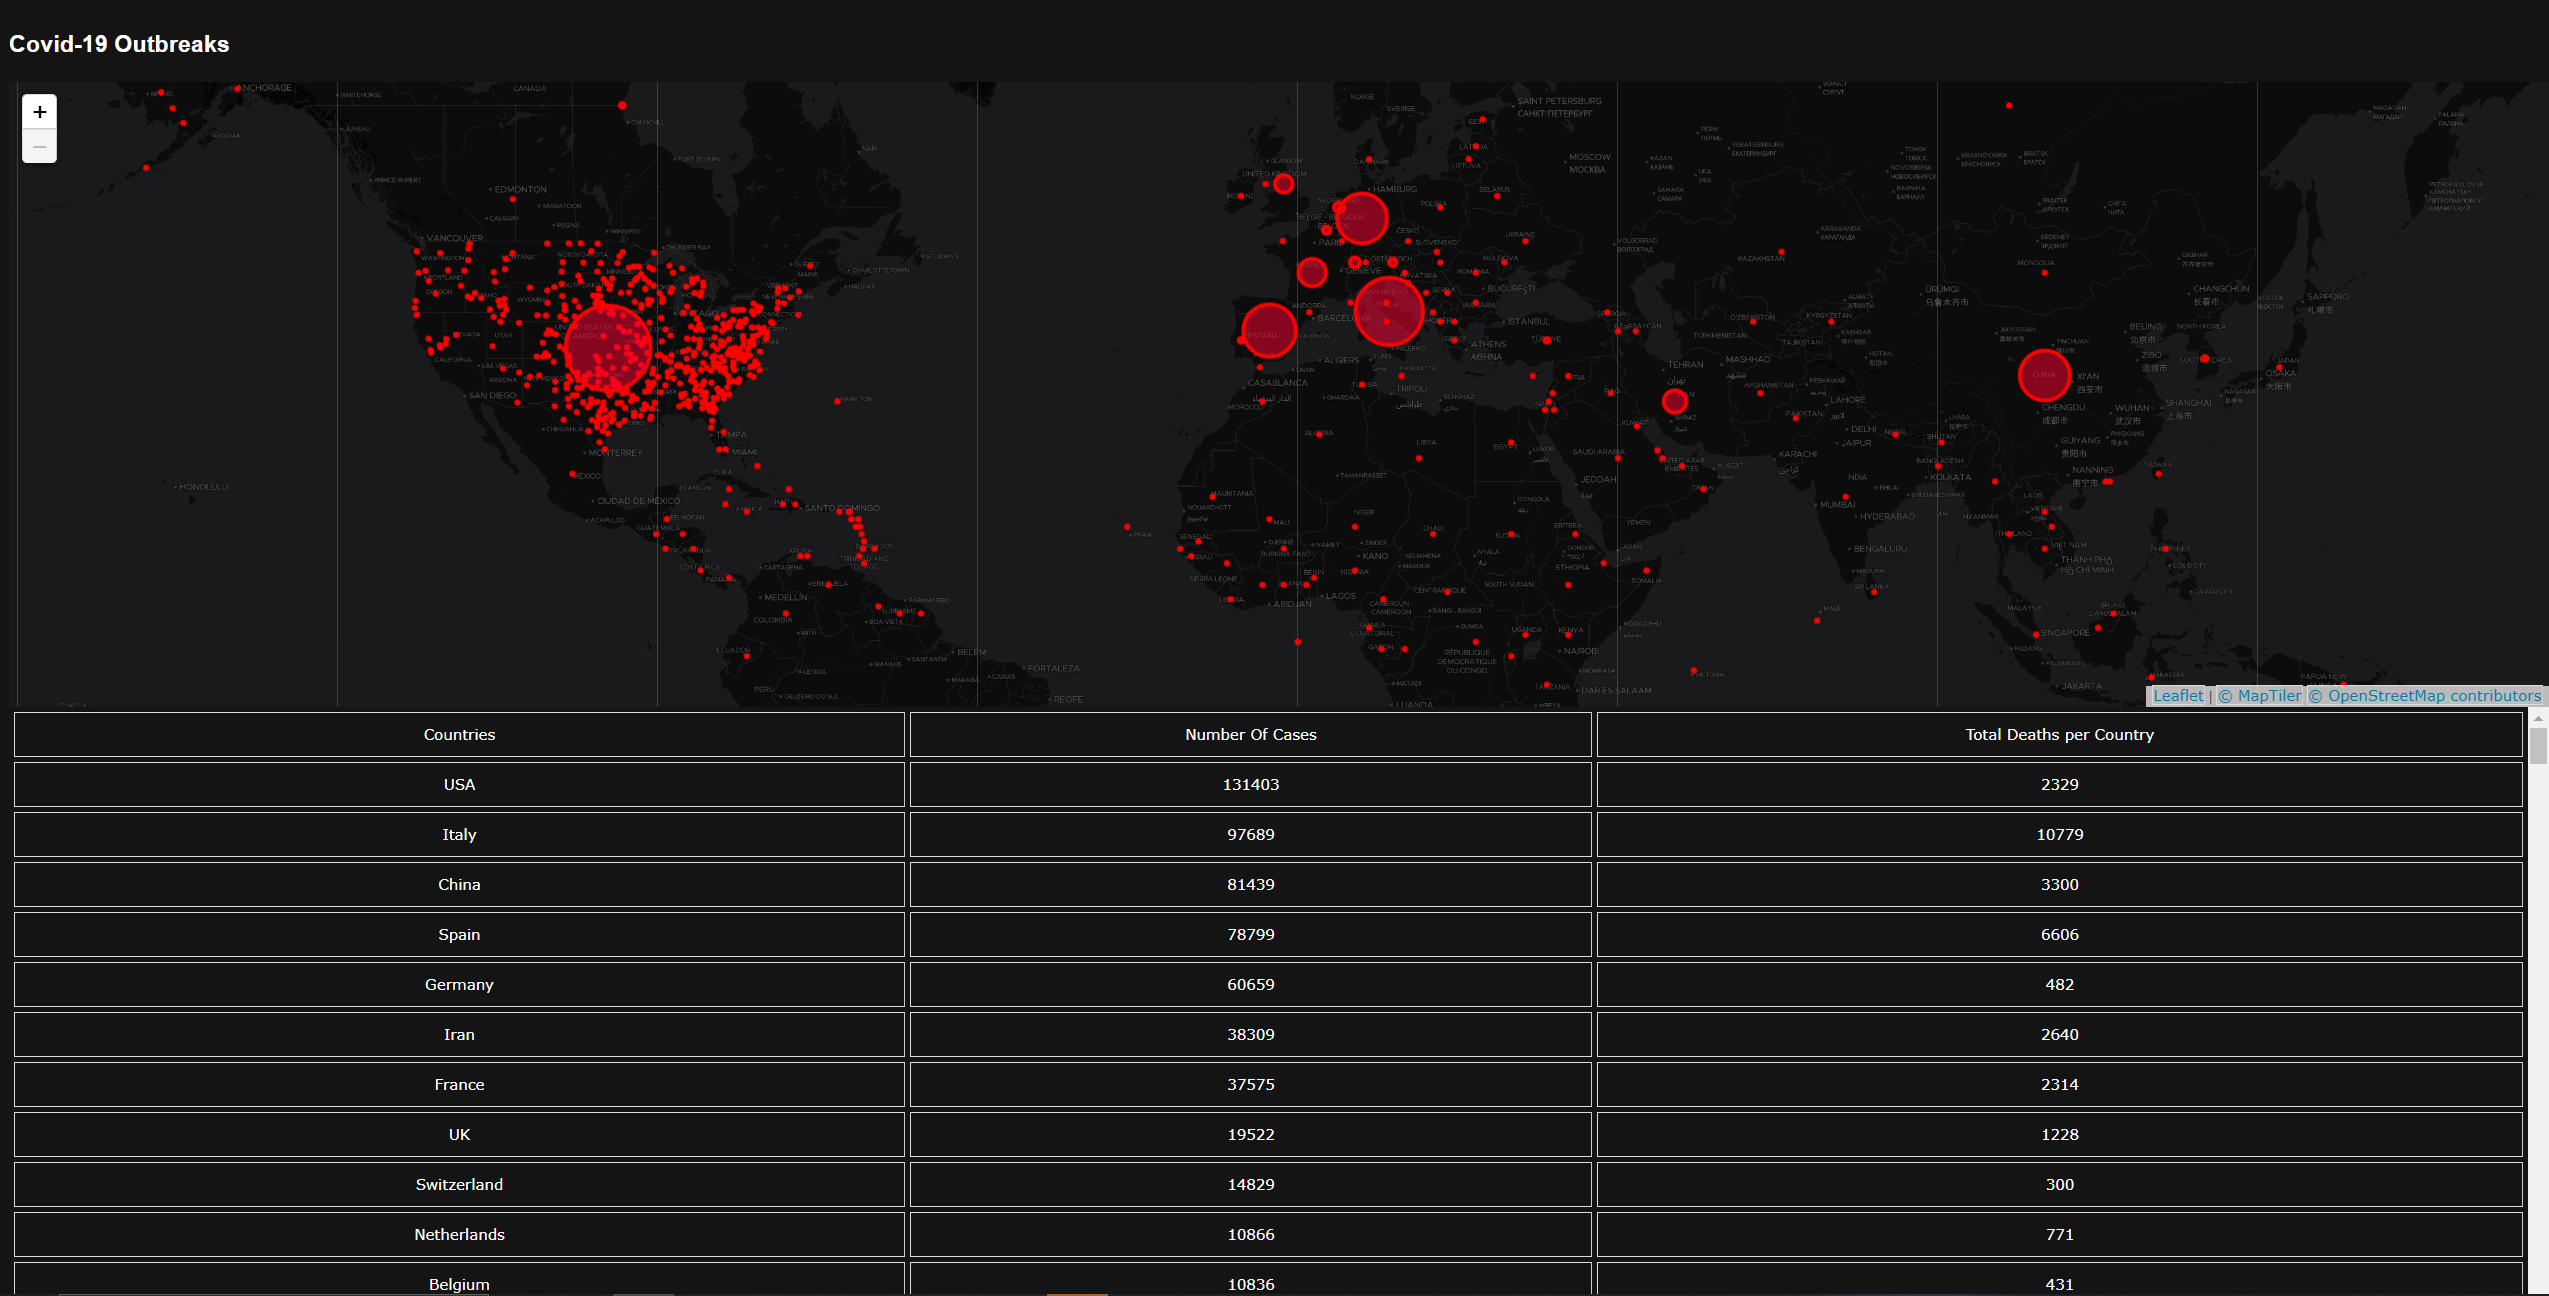
Main interactive screen
Inspiration
Due to the corona-virus pandemic happening at this moment. My team and I decided to give it a try to build a interactive map that lets you see the cases of infection happening across multiple countries, US states and US counties.
What it does
It shows you the amount of cases/infections, recoveries and deaths for each country, US states and US counties.
How we built it
We built it using python in django for the backend. Html, css and javascript for the frontend.
Challenges we ran into
We were having issues at the beginning of the project with the handling of the databases and the catching of public available apis for us to use. Once we figured it out, everything went well.
Accomplishments that we're proud of
We were happy to have an interactive map that lets you see data from different countries, US states and US counties while also showing general data for each country on a table.
What we learned
We learned to work closer as a team and gained more experience on JS and Python while developing this project.
What's next for Covid-19 Outbreaks
We plan on continuing working on this until we have a decent, more data base web app for others to try on.
Discord Members Usernames
-Ko#4747 -Logic#5969 -Tony09101#6082

Log in or sign up for Devpost to join the conversation.