-
-
-
-
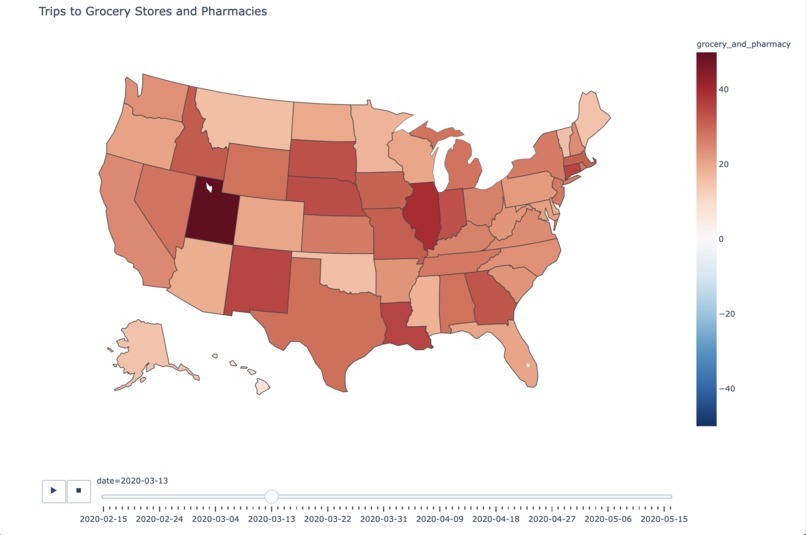
Right after National State Of Emergency was announced
-
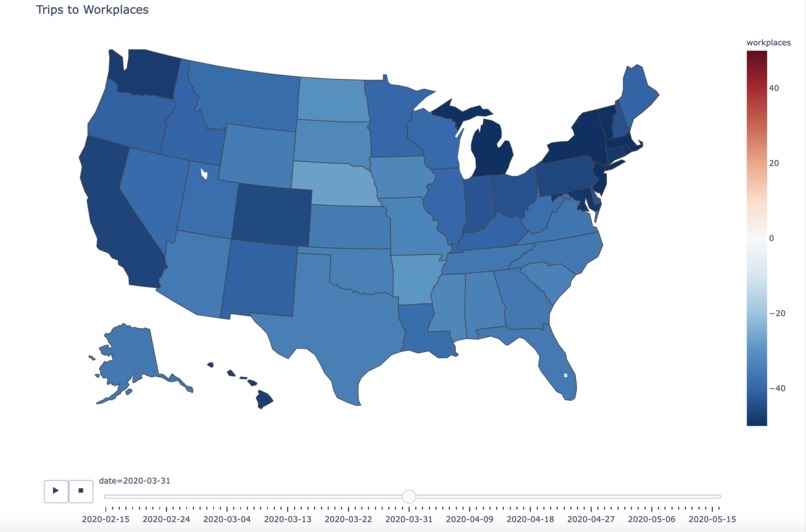
Remote Work Takes Over
-


Inspiration
The past few months have been... well, different. As a team, we realized that our daily routines have changed significantly, including where we go (and more importantly -- where we don't go!)
What it does
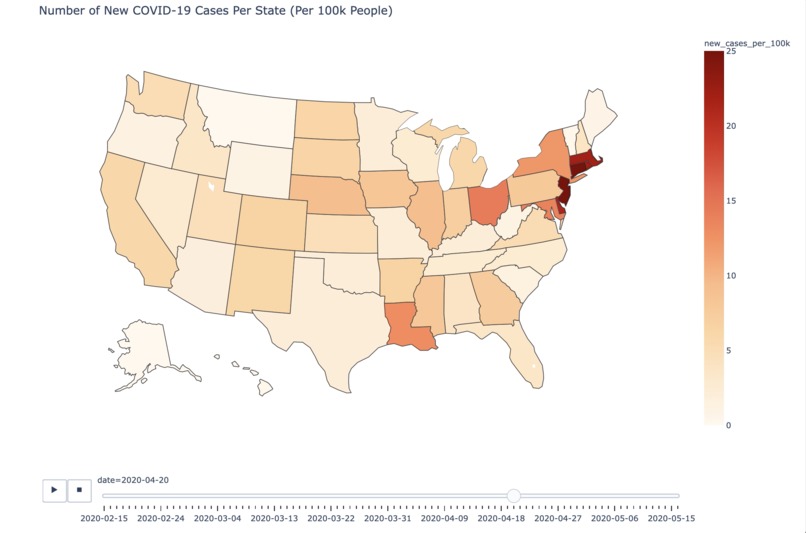
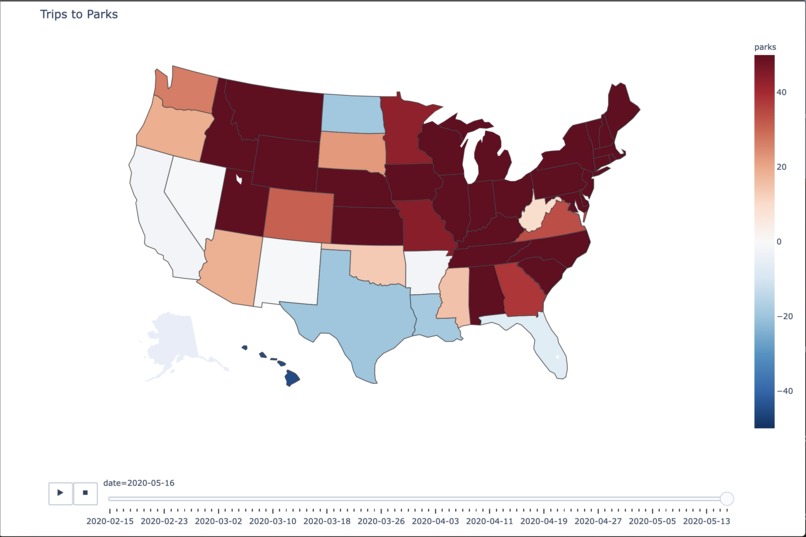
We created a time-lapse animation that visualizes COVID-19 infection rates and volume of travel to different areas (e.g., workplaces, grocery stores/pharmacies, parks) on a state by state basis. You can check out a video of a few of the time-lapses here: https://www.youtube.com/watch?v=NZjHH6oWOu4&=&feature=youtu.be.
These visualizations are color-coded; red indicates increased travel volume while blue indicates decreased travel volume (in relation to baseline measurements collected in January 2020). In addition, they are interactive --- users can slide the bar at the bottom to go backwards/forward in time and hover over states for more detailed information.
How we built it
We used public datasets from Google (https://www.google.com/covid19/mobility/ ), the US Census (https://www.census.gov/data/tables/time-series/demo/popest/2010s-counties-total.html) , and the NYTimes (https://github.com/nytimes/covid-19-data). We pre-processed the data using pandas and created the animations with plotly.
Challenges we ran into
Our original plan was to display data on a county-by-county basis. However, we had issues with debugging the code needed to run the time-lapse with plotly on a county-by-county basis, so we pivoted to a state-by-state basis instead. In addition, there were several naming discrepancies for counties between the Google mobility data and the US Census that adversely affected Virginia and Alaska. As a result, statistics for these states may not be as accurate.
Accomplishments that we're proud of
It was our first time building an interactive visualization with plotly! We're really pleased with the results we were able to achieve in less than 24 hours. We all had a fun time learning and working together.
What's next for COVID-19 Mobility Trends
We're hoping to build out a formal website to host these visualizations. In addition, we'd like to automate the data collection process, so the visualizations can be updated on a daily basis.


Log in or sign up for Devpost to join the conversation.