-
-
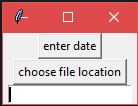
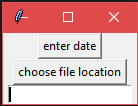
the GUI
-

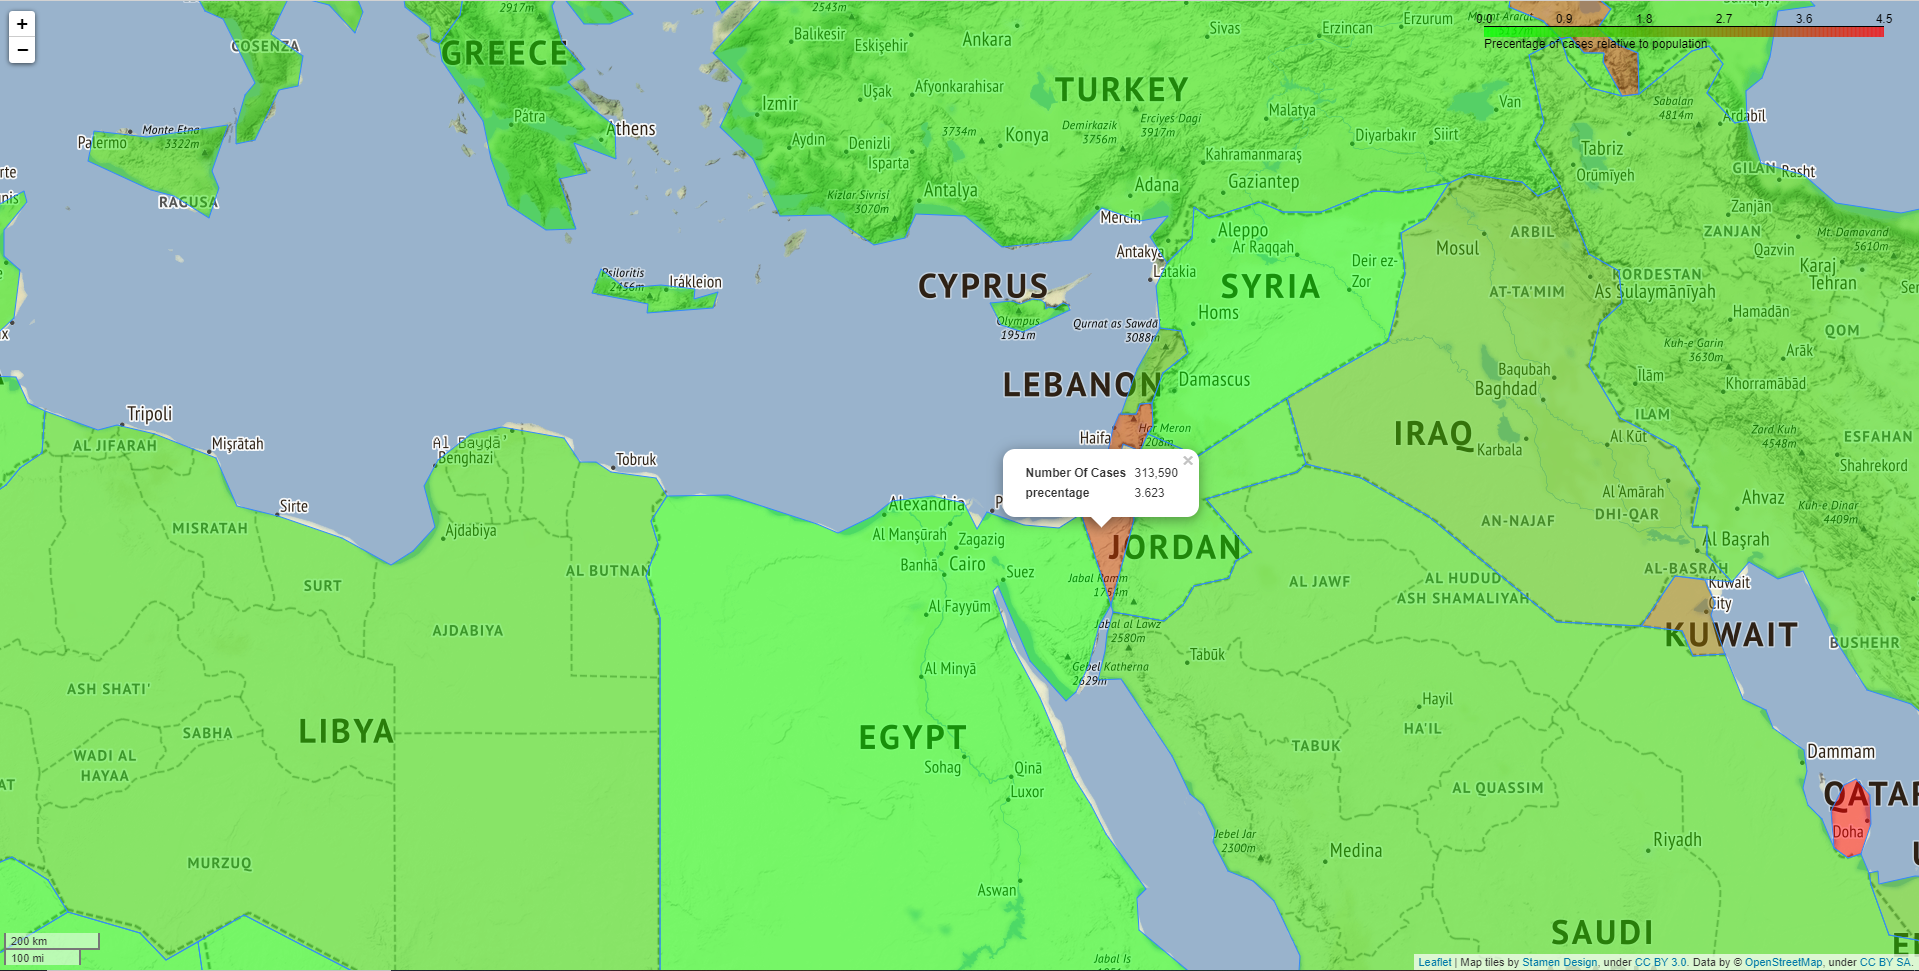
the map
Inspiration
the project is inspired by many covid-19 maps that exist today.
What it does
the program generates a map showing covid-19 cases relative to population count by country in a specific date inputted by the user.
What we used
we built the project in python using the Tkinter module for GUI and folium for the map itself, other than that we used the JSON module to read the geojson files of the map.
Challenges we ran into
one of the main challenges was the map itself, we tried several methods until we settled on using folium, after that, we had some difficulties to read the JSON file and some difficulties in deciding how to display the data on the map.
Accomplishments that we're proud of
our proudest accomplishment is the fact that this is our first time using most of the modules in the project and we learned how to use them relatively fast.
What we learned
we learned a lot about the new modules we used and we usually don't code together so it's another thing we learned in the process What's next for covid-19 map in the future, we would like to make it into a website with a timeline slider you can use to move between dates.

Log in or sign up for Devpost to join the conversation.