-
-
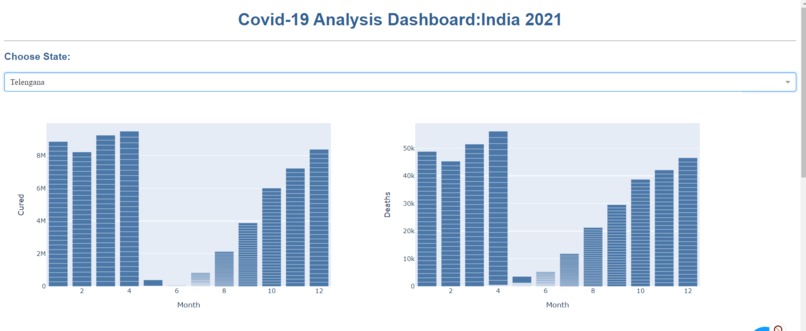
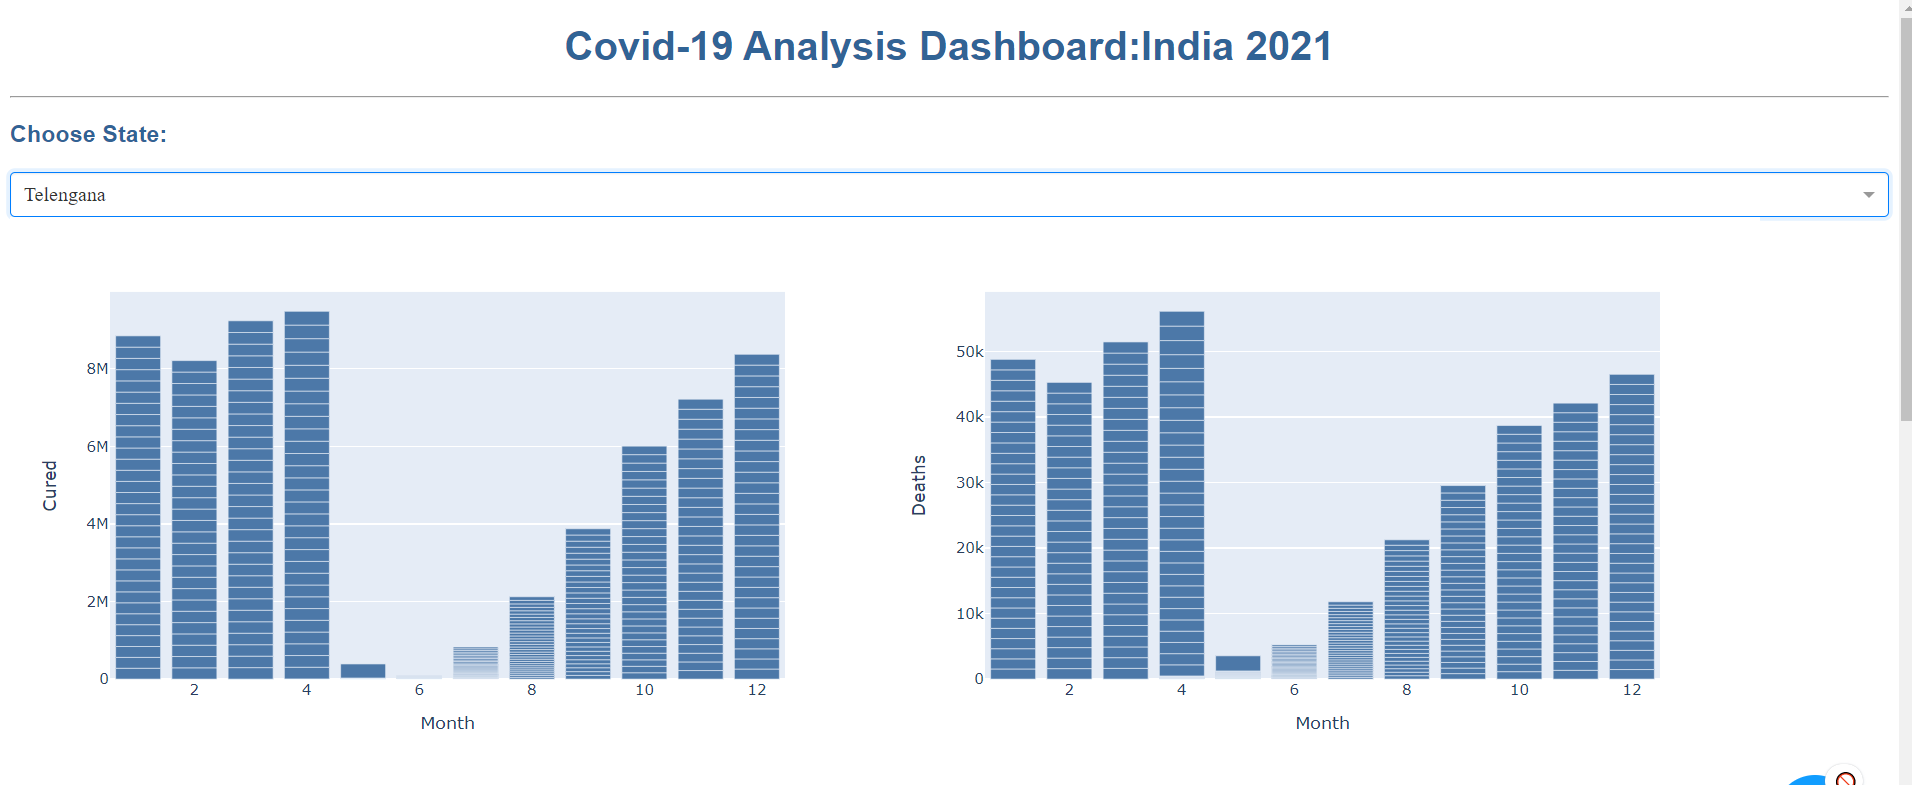
Chart1
-
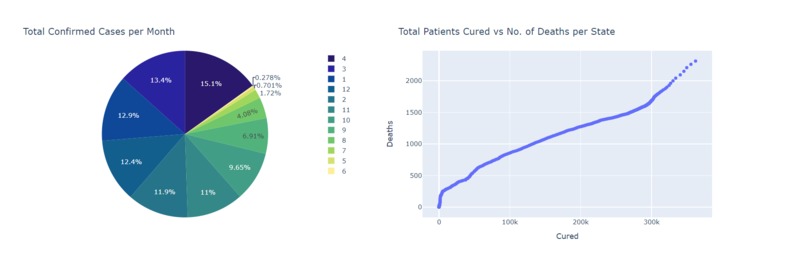
Chart2

Inspiration
Data Visualization and analysis is the crucial part in Data Science. However, I wanted a simplistic way of visualizing data and Plotly Dash meets my needs.
What it does
Given the covid-19 dataset of India, I built some interesting visualizations using Plotly Dash. The framework is built upon flask and provides an easy , low code method to visualize and analyze the data.
How we built it
The Dashboard is built upon Dash. Firstly, we clean and preprocess the data if needed. Next, we build the app layout which incorporates our plots as well as written stuff. Lastly, we connect our plots to the app using callbacks in Dash.
Challenges we ran into
Major Challenge was to build build the layout of the app, wherein I faced difficulties in providing accurate space for each of the plots.
Accomplishments that we're proud of
The Dashboard has been built perfectly.
What we learned
- I learnt to make data visualizations with low code platforms like Dash.
- Understood data analyses and what goes into understanding the data and deriving insights.
What's next for COVID-19 Interactive Dashboard using DASH
Next is, building and training Machine Learning models on the given data and visualizing the metrics and performance of the model using DASH.

Log in or sign up for Devpost to join the conversation.