-

Income and Insurance Claims VS Healthcare Access
-

Income and Insurance Claims
-
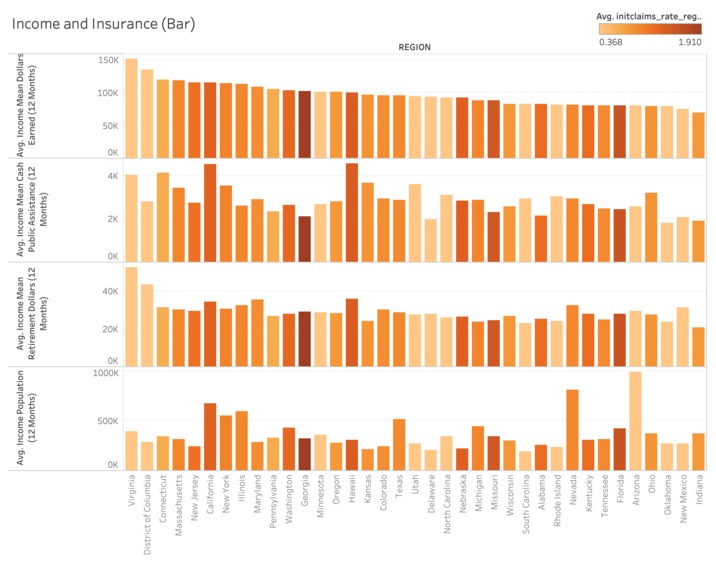
Income and Insurance Claims (Bars)


Inspiration
We have so much data and so many questions in this time of Covid-19, so it's not a bad idea to try generating some interesting insights, and through the process learn more about data-cleaning, data-wrangling and data-visualization using tools such as Tableau and Python.
Challenges I ran into
It was a challenge making sense of the large amount of data in terms of what each field represented as there wasn't much detailed information provided about the data. Additionally, it was difficult deciding how to merge the different datasets together technically (using Tableau/Python) and logically (which columns were not relevant to the analysis)
Accomplishments that I'm proud of
Considering the duration of this datathon, and the limited amount of preparation, it was great to be able to tackle a couple of questions and also get a better idea of what it means to work with data to generate useful insights.
What I learned
I learned how to merge datasets using Tableau and how to generate different kinds of visualizations using the same data so as to emphasise on specific points.
What's next for Covid-19: Income, Insurance and Healthcare Access
Hope to explore more in-depth how the factors race, educational background as well as availability of infrastructure have an impact on Covid-19!

Log in or sign up for Devpost to join the conversation.