-
-
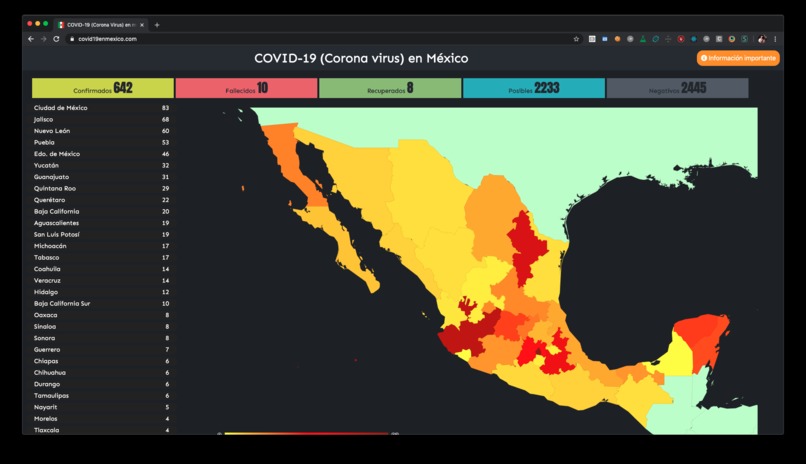
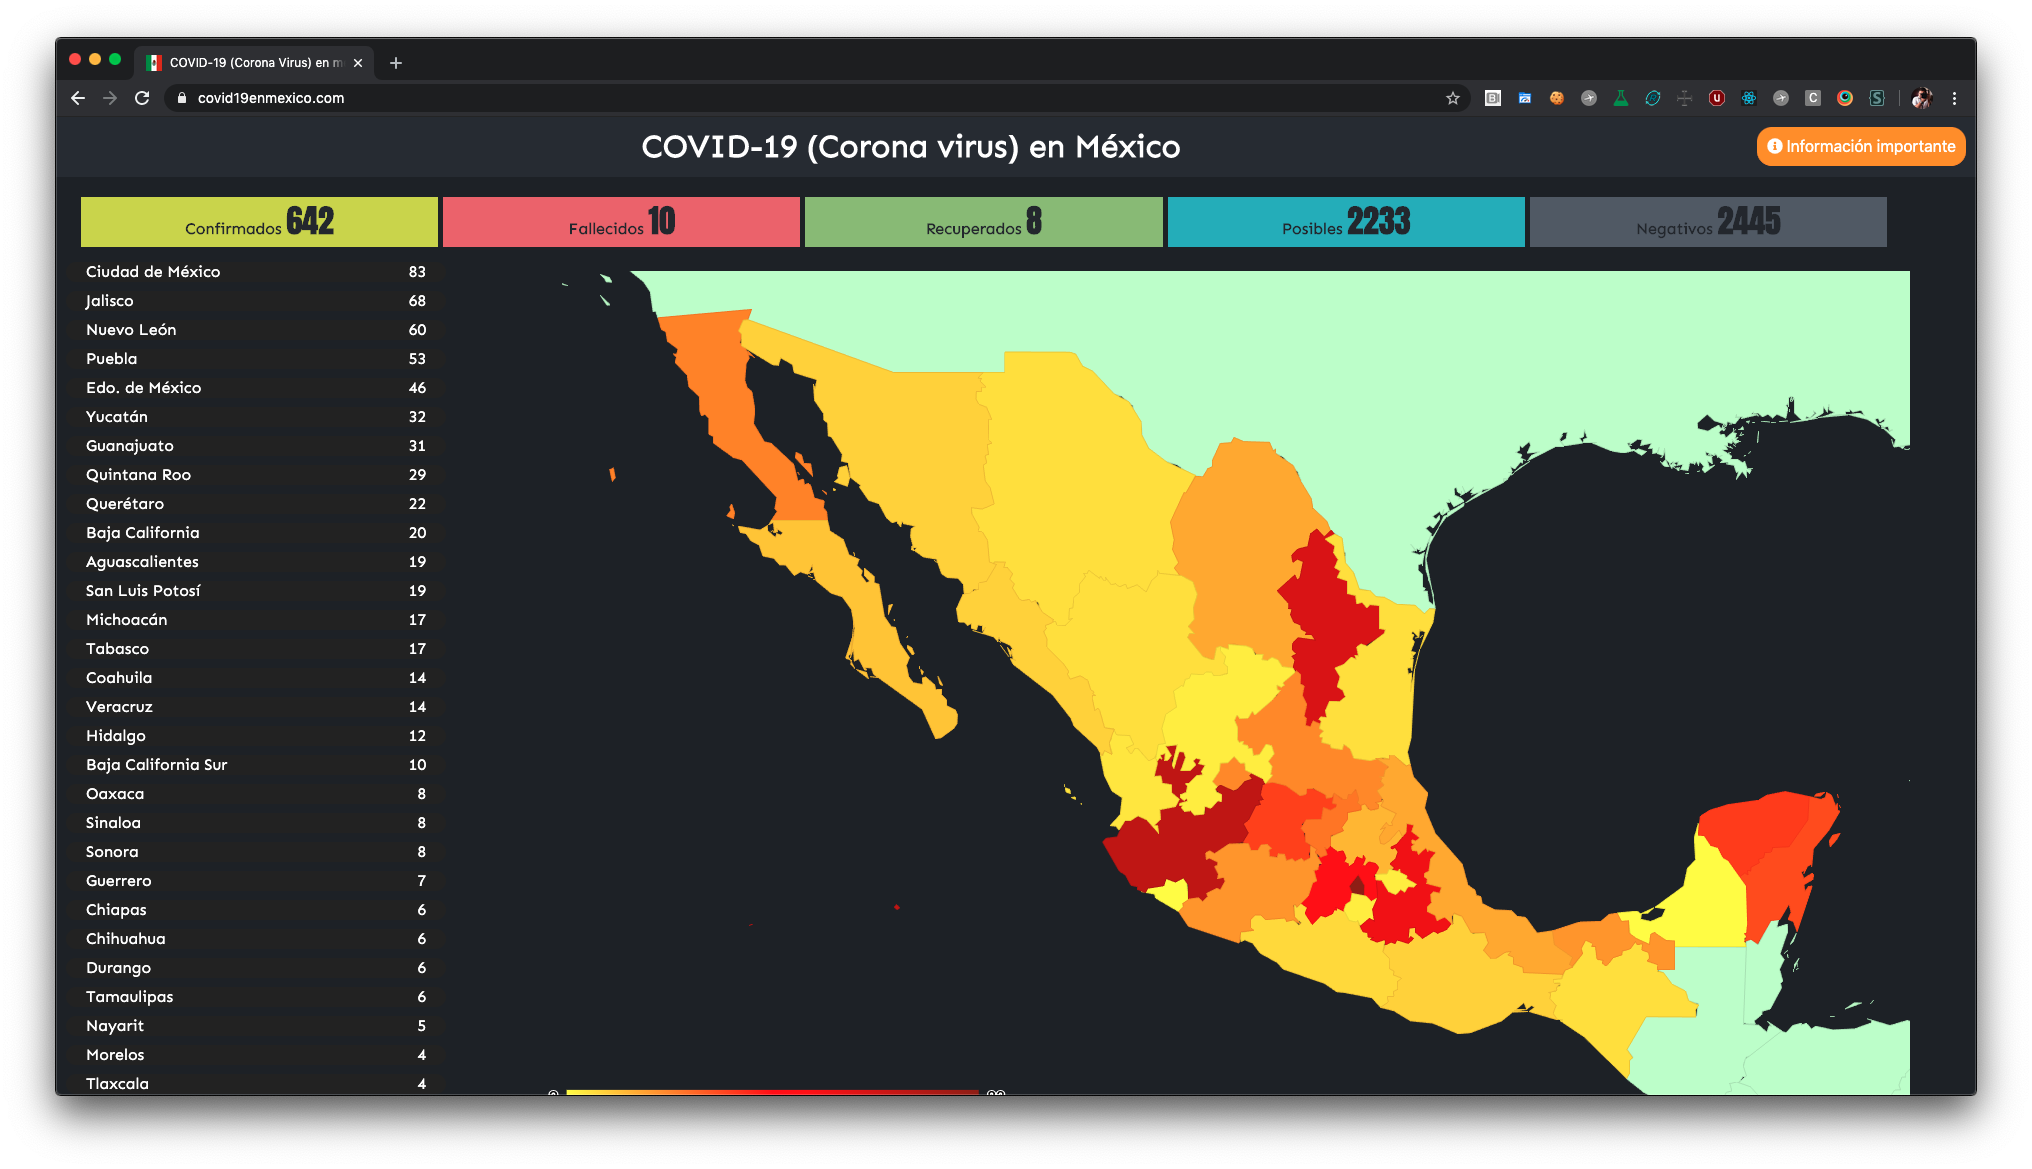
This is the desktop view of the home page
-
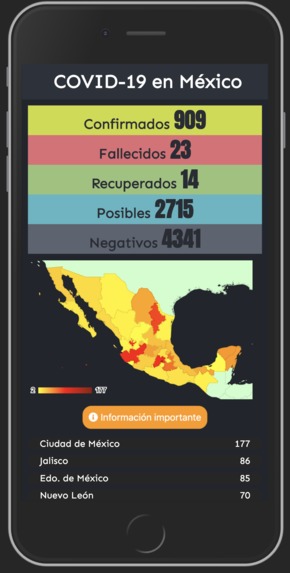
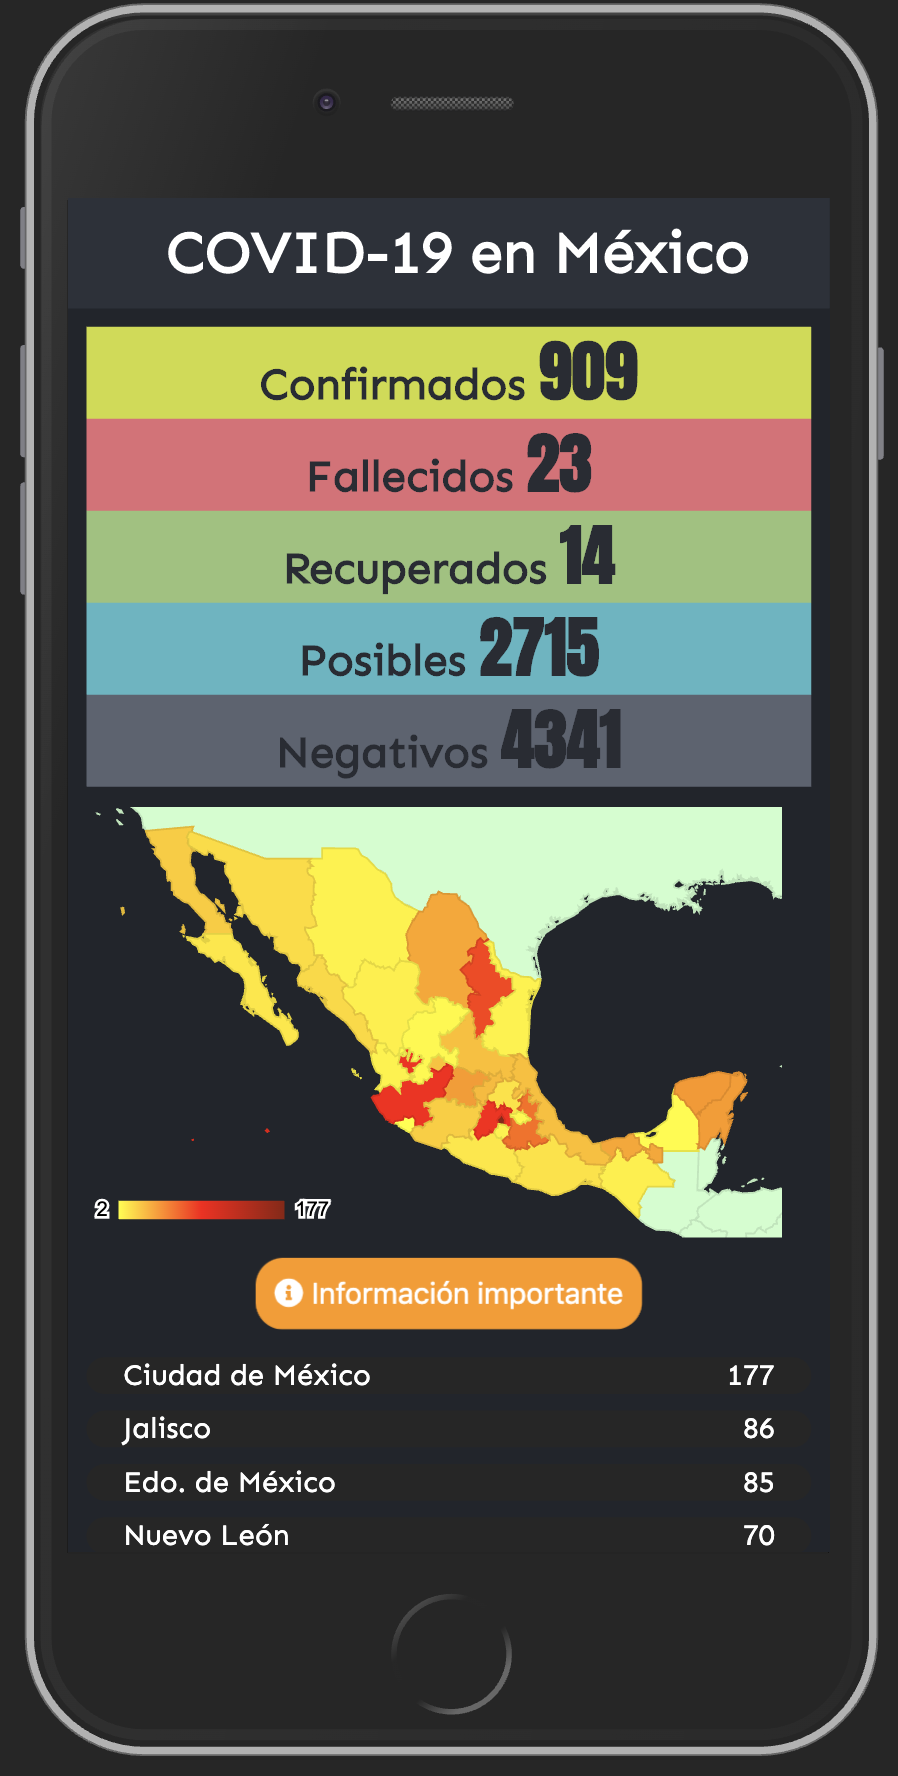
This is the mobile view of the home pagee.
-
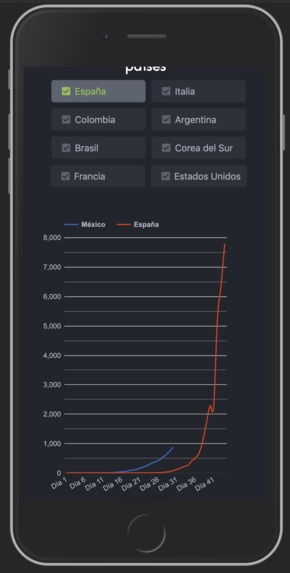
Mobile view for the graph to compare México against other countries
-
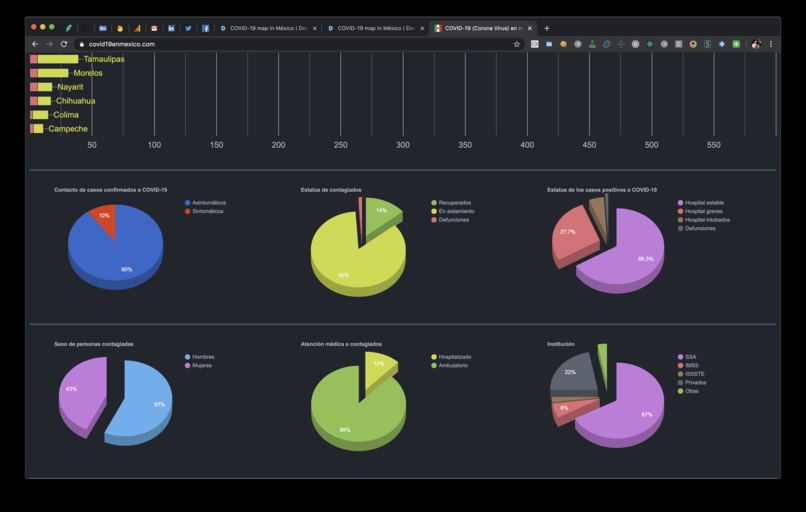
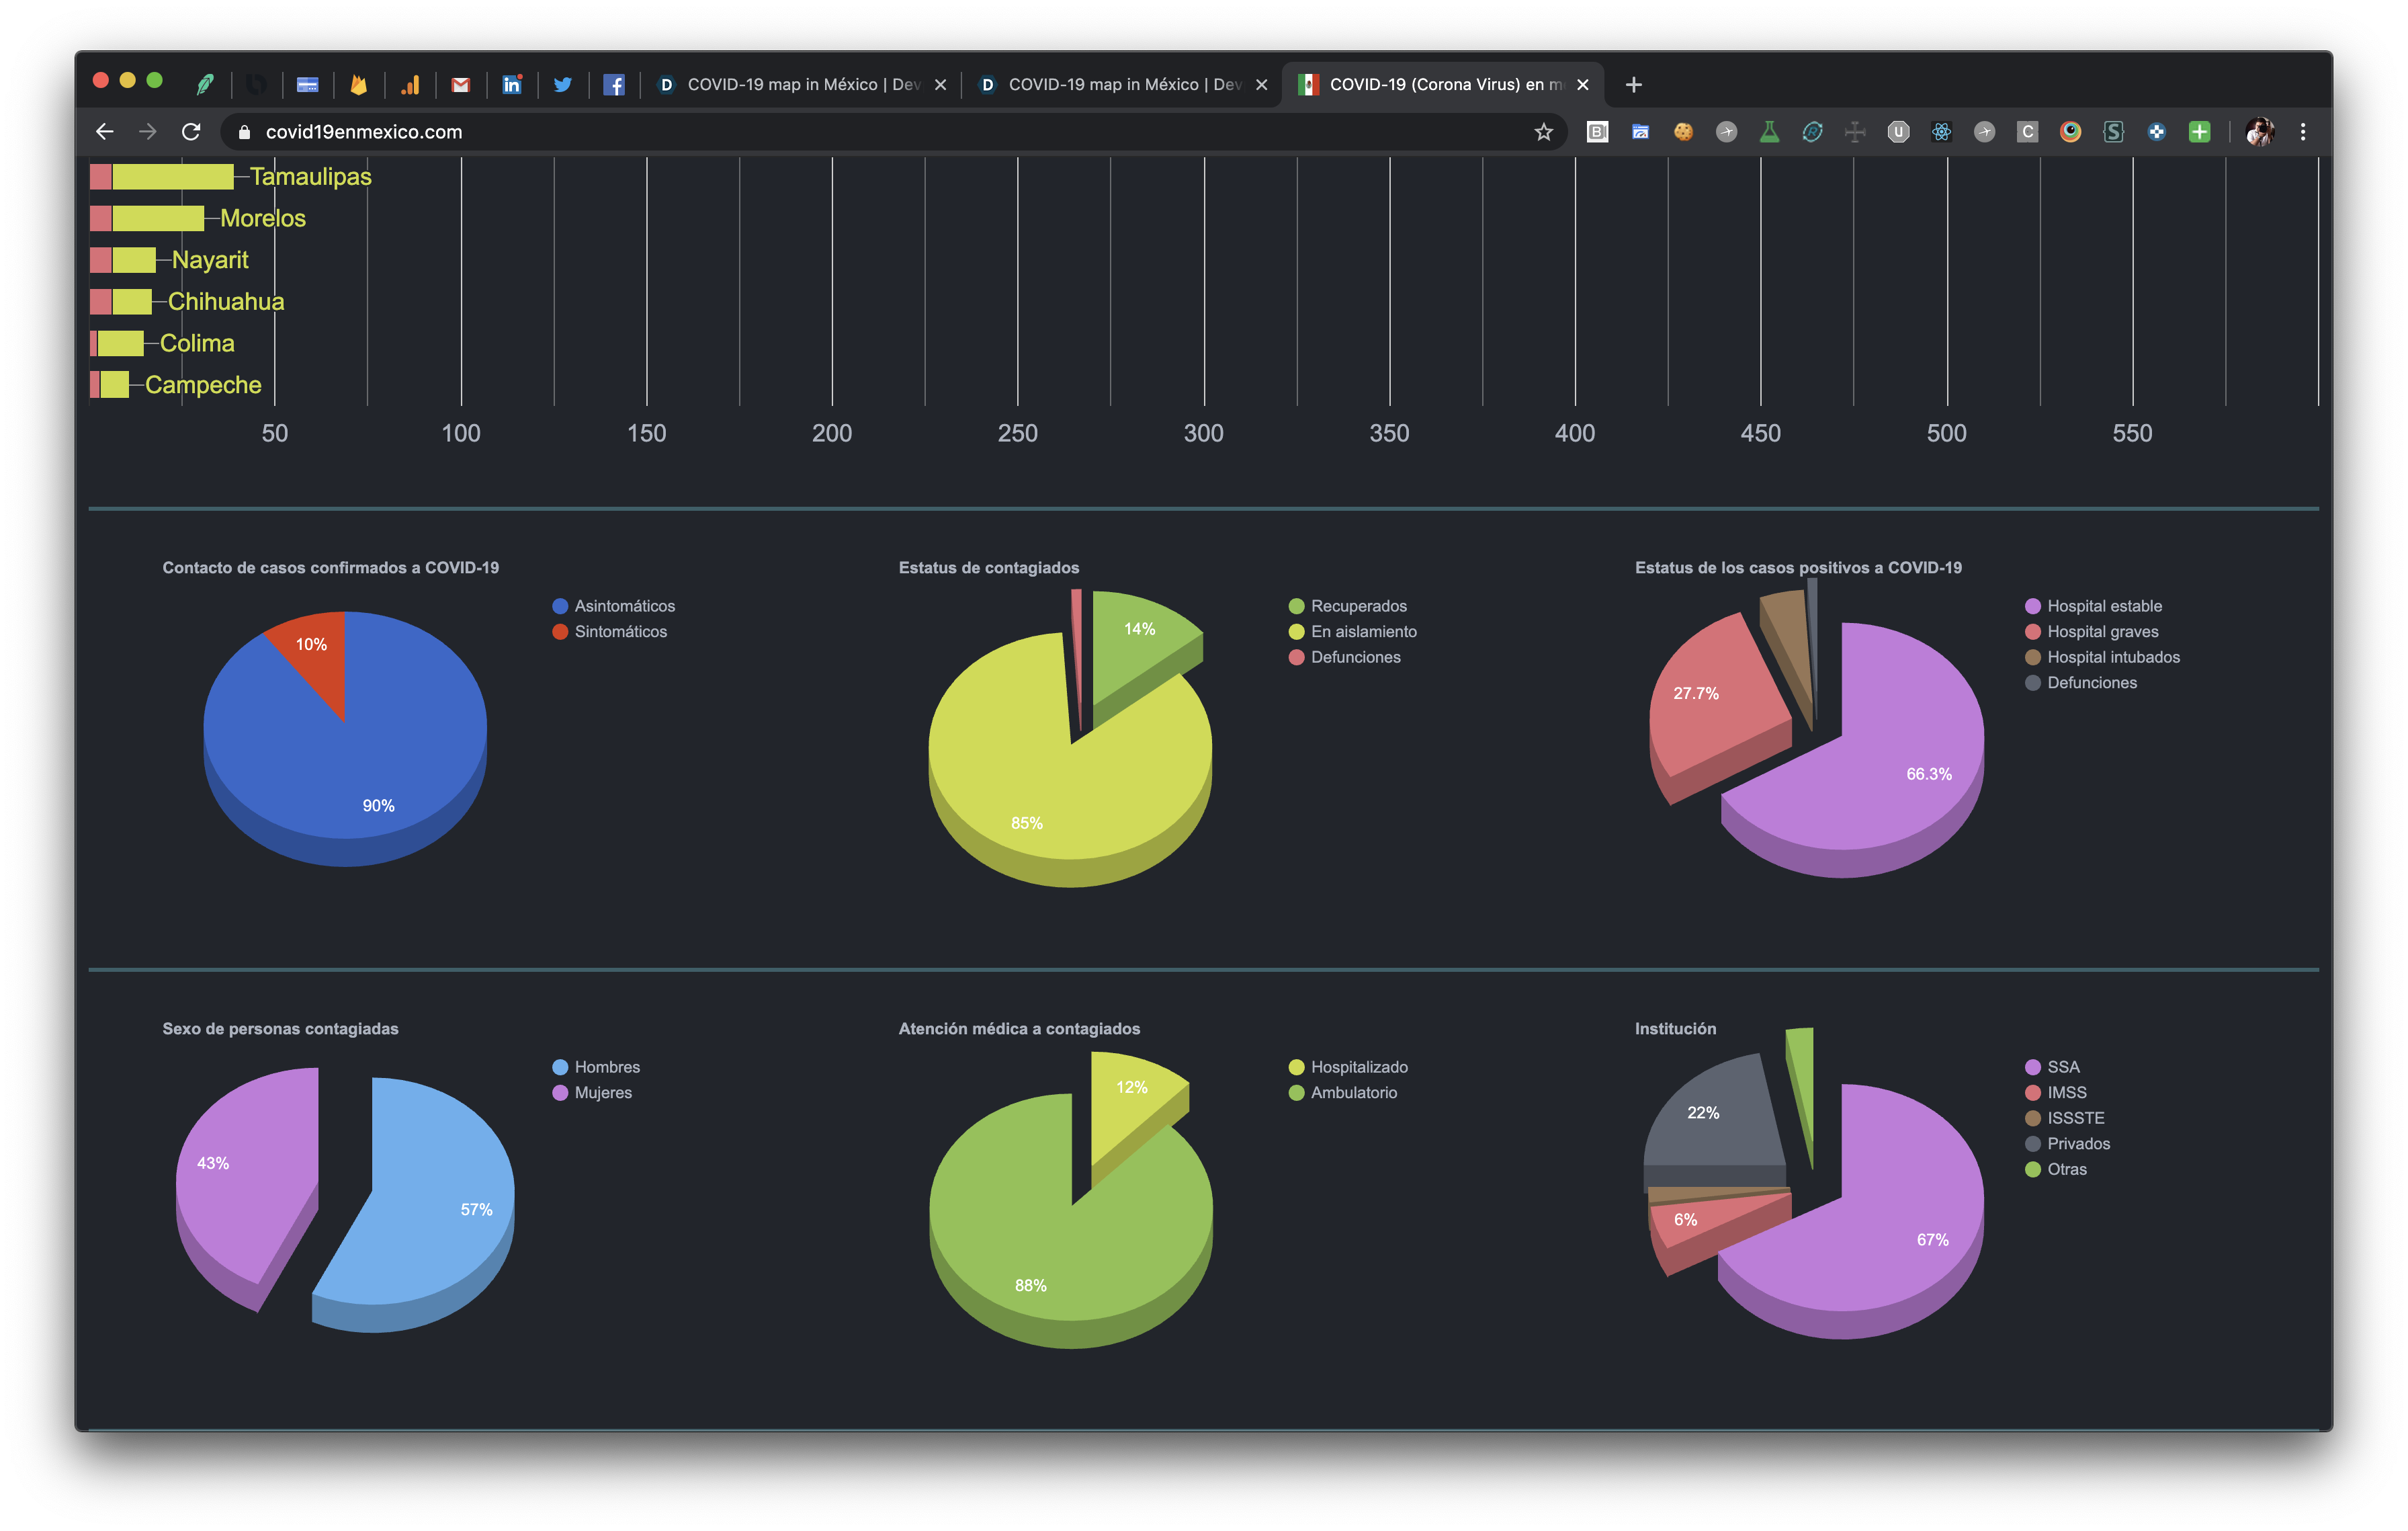
Pie charts about with some indicators about the confirmed cases in México

Inspiration
COVID-19 has made a huge impact in humanity around the world, has completely shutdown countries and has taken a lot of lives around the globe. No country is safe from it and it's creating a lot of big challenges to the countries that get hit by it. In México the tech world is emerging, there is not a culture for open data nor for easy access to data. In some areas people has been blind from it and this is an effort to make all this data accessible and easy to read and consume in the country.
What it does
This project has 2 views, the 1st view is the public view that all users can acces it from their browser and consume it, it displays in a friendly way the real status of COVID-19 in México. The home page is intended to be accesible and easy to read. With clear information about the cases, it also provides update status that let the user know when there is a new change in the numbers and shows the source from where we are getting the data to update the system. It also has multiple graphs that display different indicators of the status of the confirmed cases e.g. in hospital or not, critical or not, etc.

The 2nd view, which is the private view is an admin system that is intended to create an easy process for parsing and updating the data. It allows us to update the data, create daily archives, get total summary of cases confirmed, negatives, possibles, deaths based on the numbers of each state. This section also provide us with a mini blog where we post every update that we make to the numbers. Finally, we are expecting to have a view to connect other apis that provide numbers from other countries to display the comparisons in our homepage.
How I built it
To make things faster and easy I decided to go with firebase, google cloud platform, react, mobx, typescript and webpack. In my opinion this creates a really powerful and easy base to start working in a project that needs to be deployed and up and running in matter of days. So, I started by setting up the hosting in firebase, firestore as database within rules to have the data secured. I also created a private repo in github as I really wanted to keep any google api key that I will be storing there because of the initial rush to deploy the site. Once everything was set up I started the npm project with a couple of good practices for development like having tslint, less, webpack configs for dev and prod, commitlint and jest. Once this was set up I started with the development of the application, I created the home page and I used a dark color composition with high contrast colors to make it easier to see and also I tried to focus specially in mobile view because based on my google analytics around 80%-90% of views are in mobile, so I implemented the mobile first paradigm during development. For the graphs I'm using the react-google-charts project as is really easy to use and I was already familiar with it and I'm using multiple combinations of charts in the home page to display the data. The private section that we use to capture and update the data had a lot of work because I've been improving the process a lot, we started with everything been manual update, because of the rush of delivering the home page and then once the home page was ready I could focus more in the private section, now we are half way in automated captures. I don't think we will accomplish 100% automated to capture all the data because of the challenges we face but at least is some progress. The next improvement areas are adding more graphs, adding more data sources to be able to make more comparisons between how México is doing against other countries, and if there is more time I would like to refactor it a bit, to make the project more scalable so that, if any other country would like to use the same project to display data for it, use the same country just different data source.
Challenges I ran into
There were a ton of challenges, the first one, in México the culture for open data is not well taken yet. So, I will start with there is not api that provide this data. There is not even an friendly data format to work with, the federal government publish 2 pdf files one with a table of confirmed cases and the other one with a table of possible cases and the url where these pdfs are published changes a lot, right now is here: government url hopefully it's still here when you review this. So, there is no easy way to read these pdf files, parse them and save the data. So, we came with the idea to manually capture the cases into the system. After a couple of days of doing this we found that federal government was getting the data from each state at 1pm and they were publishing at 6pm, so by the time federal government publish their data, the real number is completely different and people were complaining about it. But most of the states publish their data 3 times per day (morning, afternoon, night). So, what we are doing is updating our system every time the states publish their report which is easier because is less data to update, sometimes only 2 - 3 states and once the federal file is published we validate that we are in the same page plus the ones that were published after their cut and now instead of being capturing manually the numbers we automatically get those numbers from what we already have in the database and also we automated a process to archive the final numbers at end of day. so that we have the data saved in our database to be used in different graphs that are planned for the future. And I'm currently working in a code that is trying to go through the pdf and parse it, but this is really hard to do still WIP.
Another technical challenge we faced was: how to display all this data in a friendly and easy view that can fit in a smartphone screen, I had to do a lot of back and forth between different charts, text colors, fonts, font sizes, etc. So far, I think what we have so far is fine, still room for improvement but the feedback we have asked is positive so far.
Another hard challenge I had was in the graph where México trend is compared with other countries, there are a lot of variables, some customizations that I wanted to add to the graph and also some technical challenges making sure the data is correctly parsed. So it took some brain time to code it but at the end I'm pretty happy with the result of it.
Accomplishments that I'm proud of
- I'm proud that we just launched the website live and now we have more than 30k views in our site after 4 days and the feedback has been pretty good, people really like it and find it useful. I also posted the site in linked In and everybody has been congratulating the project which I'm really happy for it. post in linked in
- Another accomplishment is that the initial development took only 2 days to be up and running in live with data and graphs to be consumed.
- We have improved the time of capturing the data from being 1 hour to be now around 15 mins, because of the improves that we have done to our private view.
- I think the mobile view is pretty nice, because 80%-90% of our users are mobile views and feedback so far has been really good.
What I learned
I learned that lot of governments aren't using all the technologies we have available for us to make data/announcements easier and more accesible. We have a really good opportunity to reach more people with the help of technologies in 2020 and is sad that the governments that because of their nature should be using them to get to everywhere on their territories, they are not using them.
I also learned that if we communicate more this data to more people, we can cause an impact on them and we all can be more aware of what is happening around us, in this case the covid-19 and hopefully it can help to people to think about it and help to prevent the spread of it.
Also I learned that anybody can help from our own side, when humanity need it and this is how I'm trying to do a change, trying to do something from what I know without getting anything economically. I'm just using what I know to try to take this message to everybody in México.
What's next for COVID-19 in México
We will continue trying to publish all data we have available, showing the status of it to the world and hopefully we help to prevent the spread of this virus that is challenging us really hard.


Log in or sign up for Devpost to join the conversation.