Inspiration
Make the tracking of COVID-19 data easier and more interactive.
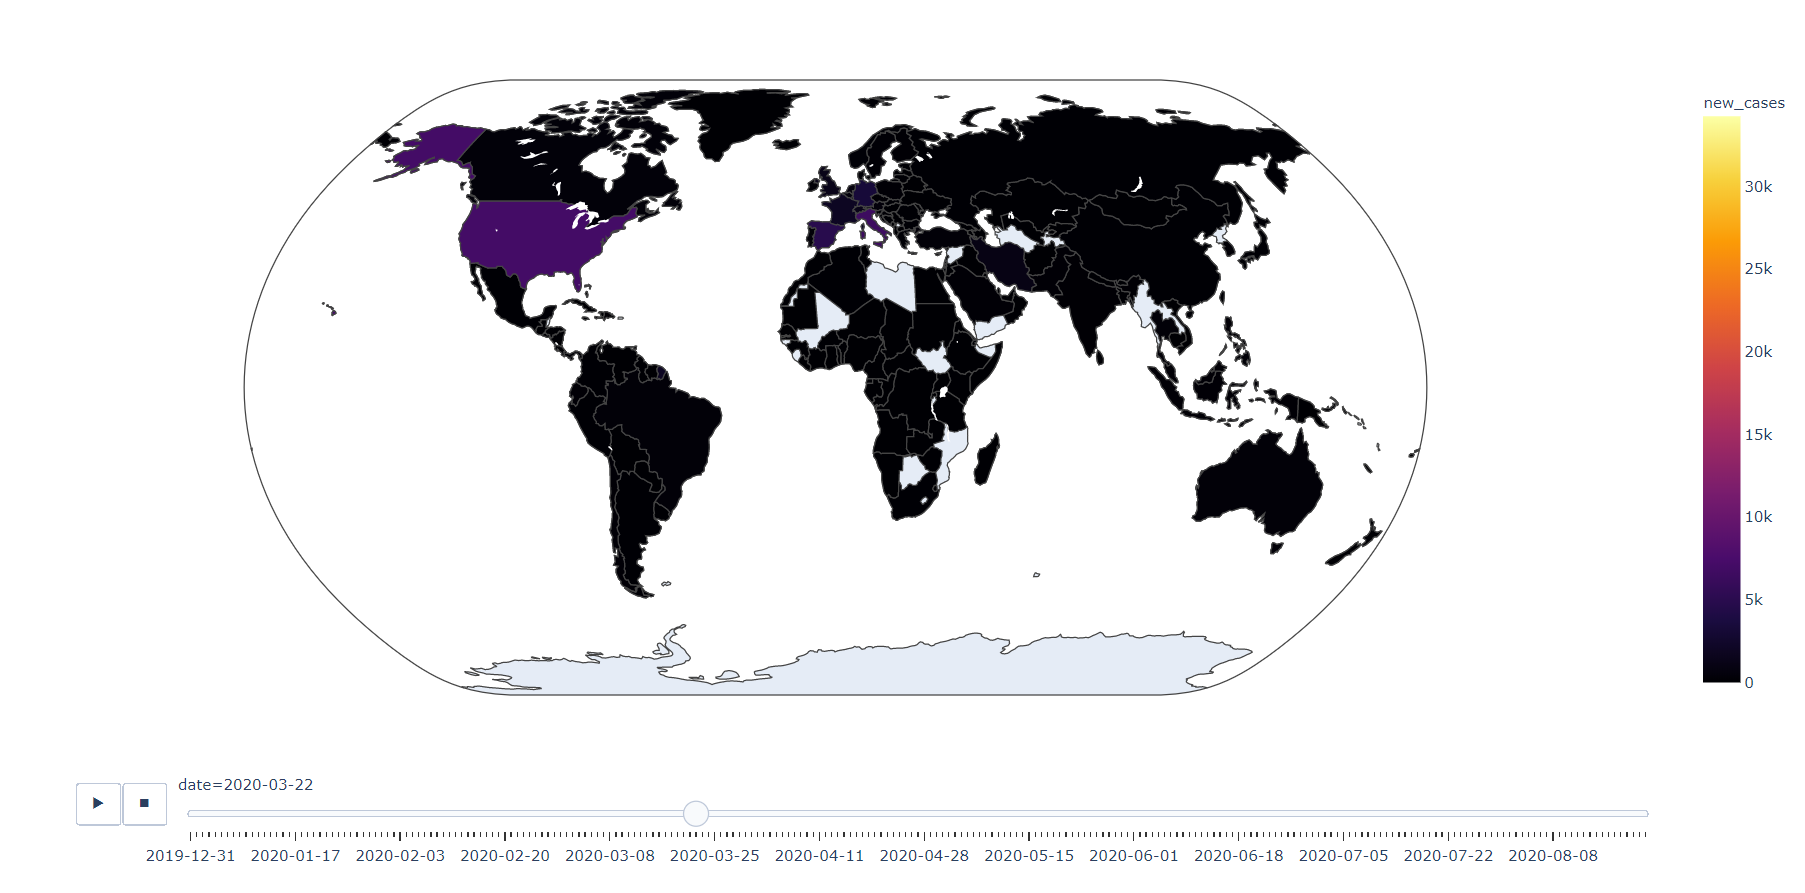
What it does
Gets the latest data of COVID-19 and visualizes it in charts and maps.
How I built it
I used python. For GUI , I used pyqt5 library and for html extracted figures, I used plotly library
Challenges I ran into
Handling some errors and turn the data into visualizations.
What's next for COVID-19 Data Tracker
Converting it into mobile app for easier and faster usage. Deployment into a web domain.

Log in or sign up for Devpost to join the conversation.