-
-
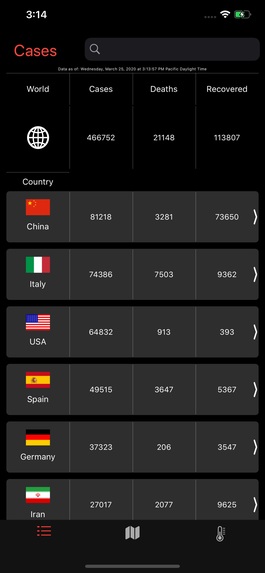
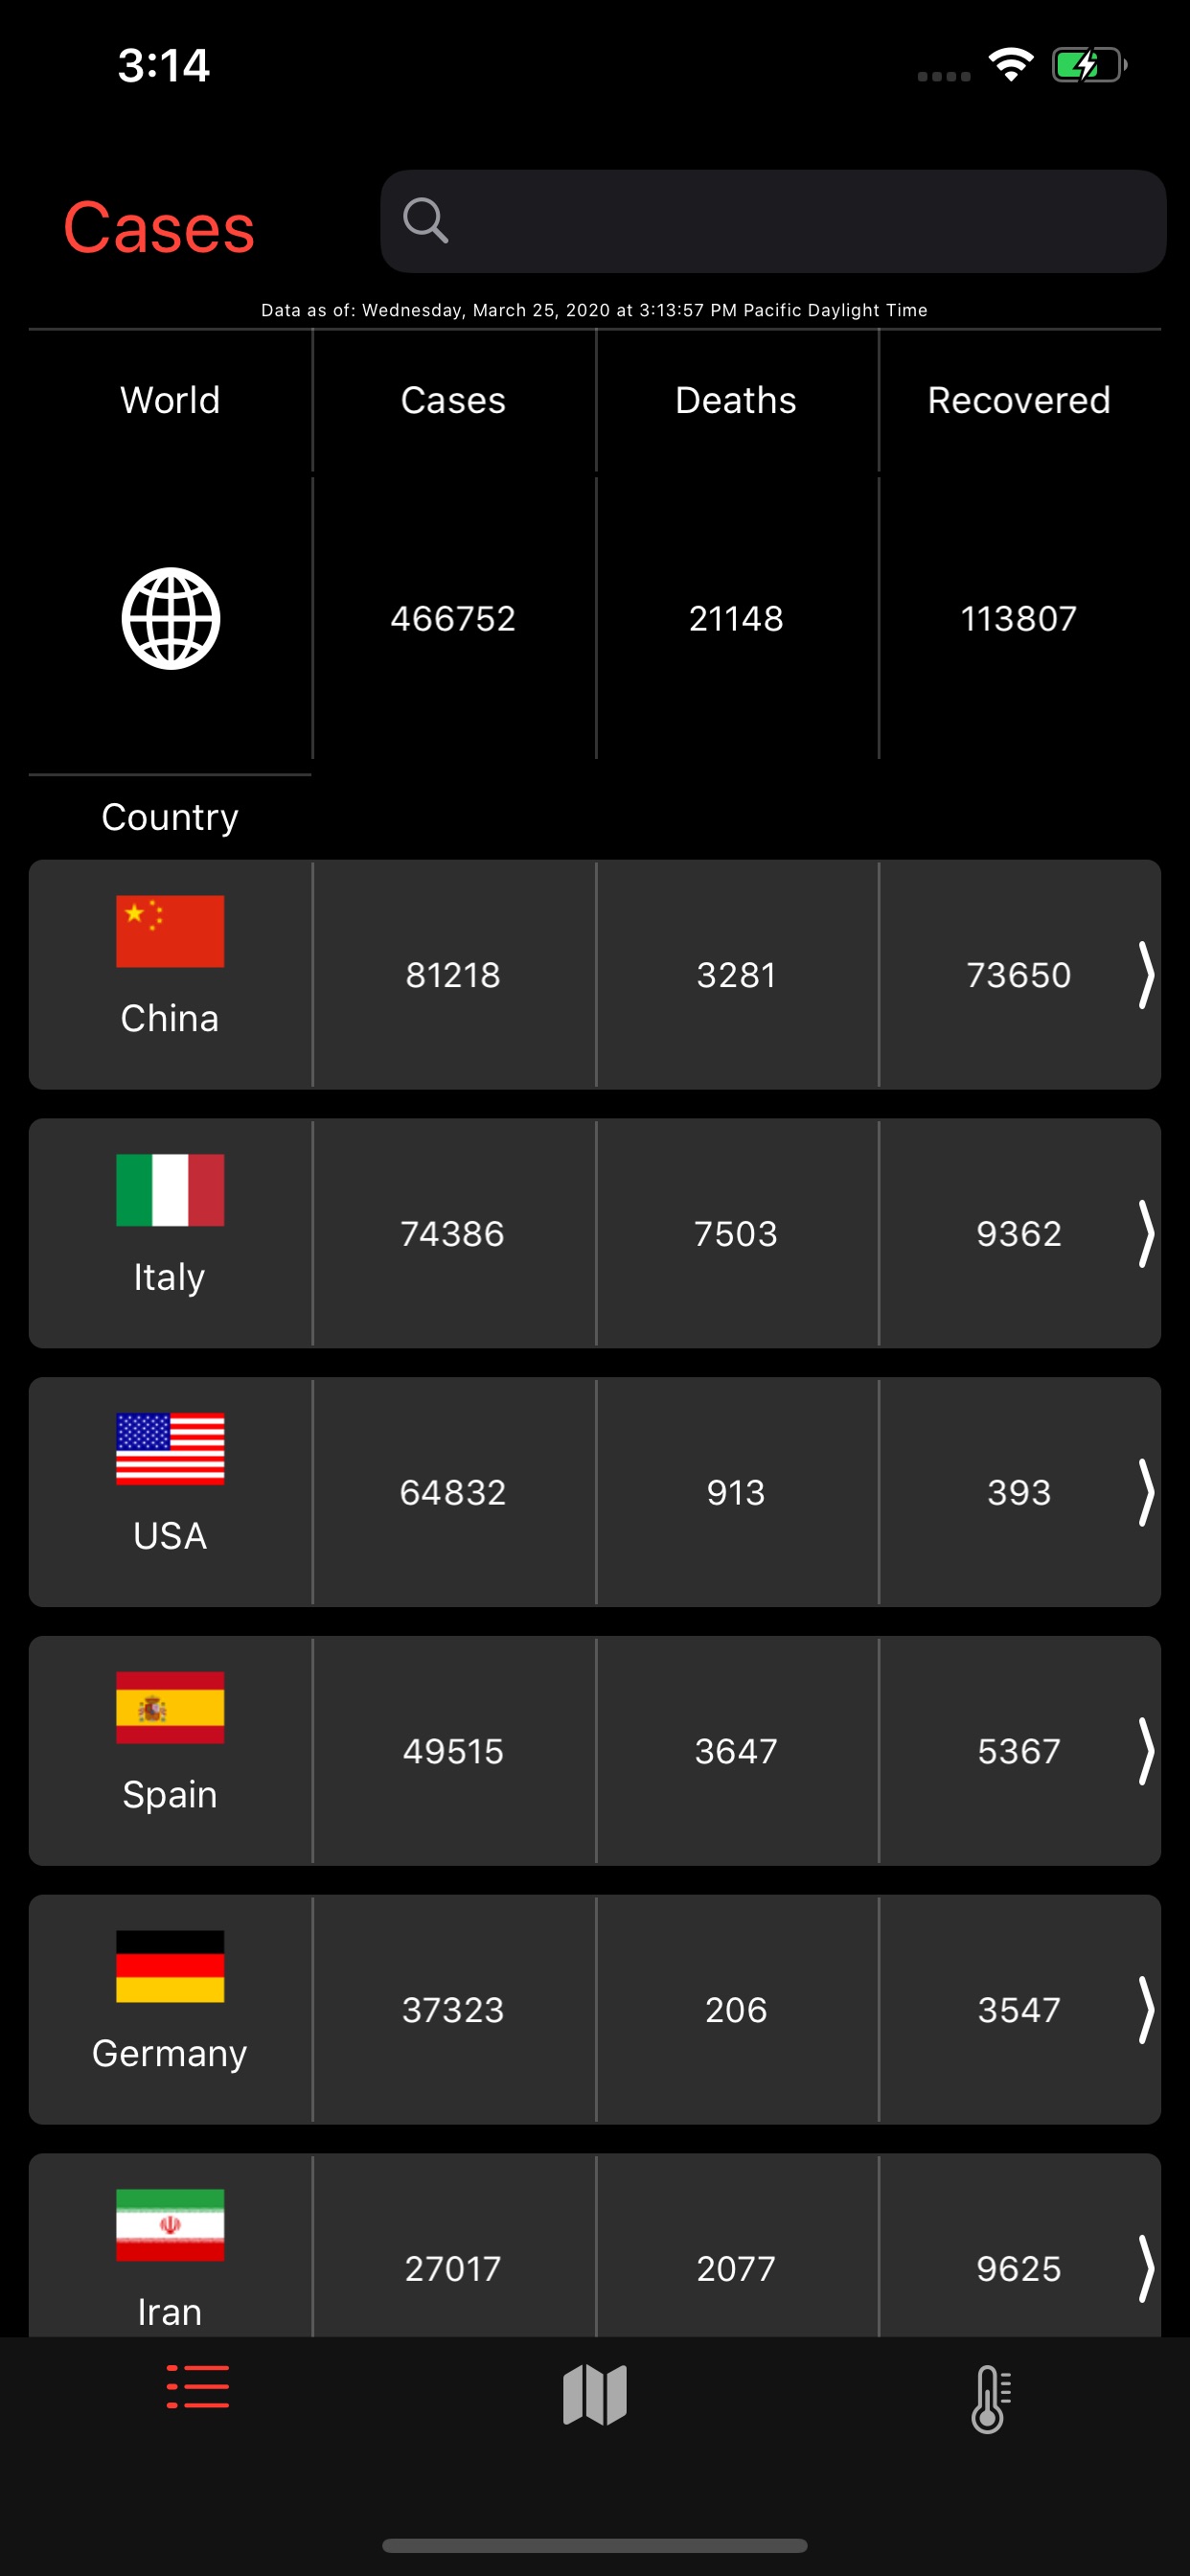
This is the big-picture view, with data for the world and for various countries, as well as a searchbar.
-
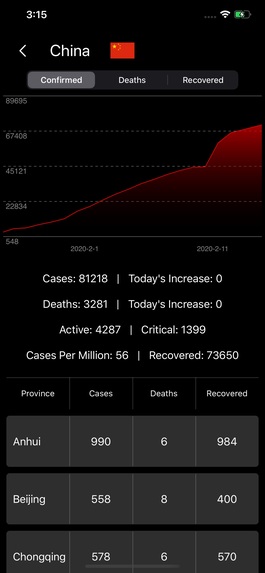
This is an example of nation-specific data, with the case numbers for the nation both in graph form over time and in text form for the day.
-
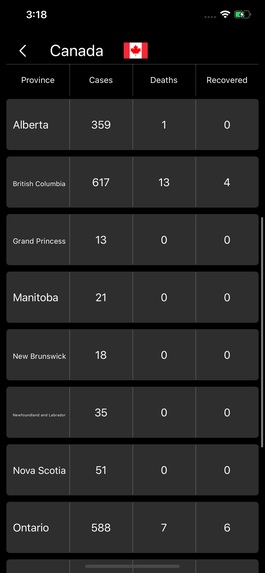
This is an example of provincial case data, displayed in this case for Canada's provinces.
-
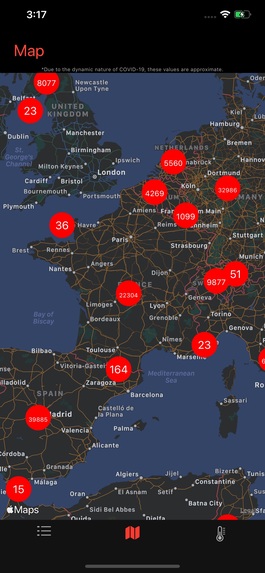
This is the geographic data feature, depicting the geographic spread of COVID-19 rather than just listing data.
-

This is the information section on COVID-19, with links to the WHO and CDC websites.


Inspiration
The spread of COVID-19 around the world prompted an unnerving response from the populous of many affected countries. This included panic buying of numerous commodities and goods necessary for smooth societal function, not as a result of governmental moratoriums on transactional activity in the future, but because of mass panic over the spread of the disease. It was clear that a solution to provide accurate, real-time data on the spread of COVID-19 that was easily accessible around the world, and that utilized reputable sources for data was needed, to provide perspective on the outbreak, and perhaps reduce public hysteria so that a more coordinated approach to stemming the spread would become possible.
What it does
The resultant solution is COVID-19 Data, an app that provides accurate, real-time data on the spread of COVID-19 from sources including JHU CSSE's APIs, and organizes this information with ease-of use in mind. The app features a three-pronged approach to data organization: big picture, nation-specific, and geographic-specific. In the case of the big-picture section, case, death, and recovery counts are displayed for the world as a whole, as well as for countries in order of the severity of their localized outbreaks. This allows users to gauge the extent to which their nation is affected in the context of other nations. Nation-specific data contains significantly more specialized data for the selected country, including case and death numbers and their changes over the course of the day as compared to the previous day, active case numbers, critical case numbers, data on the spread of COVID-19 based on province or similar sub locality, and arguably most importantly, data on the number of cases per million in the nation. This information is organized neatly, and in an easy to read manner, as well as in graphs depicting cases, deaths, and recoveries with smooth user interaction functionality. Lastly, the geographic-specific section depicts the spread of COVID-19 in the context of a map, with case numbers listed within the region they account for, and with the capability to click on such markers to arrive at more specialized information on that specific region.
What's next for COVID-19 Data
The next steps for COVID-19 Data include: implementing data extrapolation features to predict where the pandemic may go in terms of case numbers in the future and developing a self reporting feature for potential patients with failsafes to prevent false positives (it is not clear yet what these failsafes may be).


Log in or sign up for Devpost to join the conversation.