-
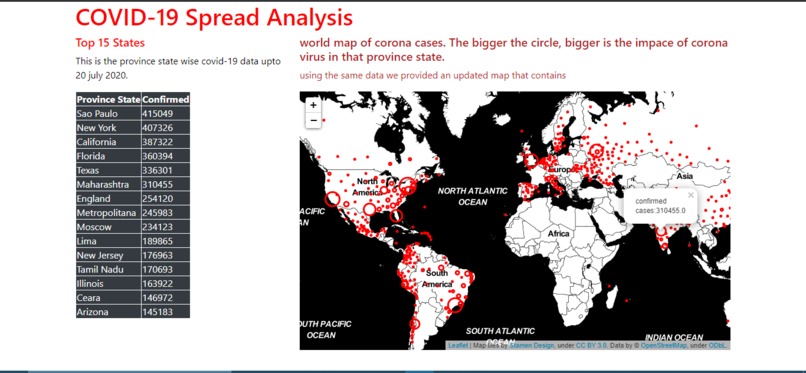
Dashboard output

Inspiration
When I watched the news I saw the anchors showing a demographic view of the Covid-19 pandemic and this drived me to implement the same in a web-app
What it does
Basically my app shows the total number of active aka confirmed cases in every country.
How I built it
I had referred to "https://data-flair.training/blogs/covid-19-spread-analysis-python/" for the setup but in addition I applied my own version of HTML and CSS code.
Challenges I ran into
The problem is the dataset availability; Though it was given in the site itself but the dataset was updated till July 2020 only which shows the total cases till 20th July 2020 The other challenge was I did not know how to run a flask application, how to use Folium-titles so i referred "https://www.geeksforgeeks.org/stamen-toner-stamen-terrain-and-mapbox-bright-maps-in-python-folium/#:~:text=The%20tiles%20include%20stamen%20tone,shading%20and%20natural%20vegetation%20colors." for Folium-titles and "https://www.geeksforgeeks.org/flask-creating-first-simple-application/" for running my flask app
Accomplishments that I'm proud of
Well there is a small achivement is that the desired output was achieved and this was a satisfaction for me.
What I learned
Well as mentioned above I learned on how to implement a web-app on Flask framework and also learnt about new python package called Folium.

Log in or sign up for Devpost to join the conversation.