-

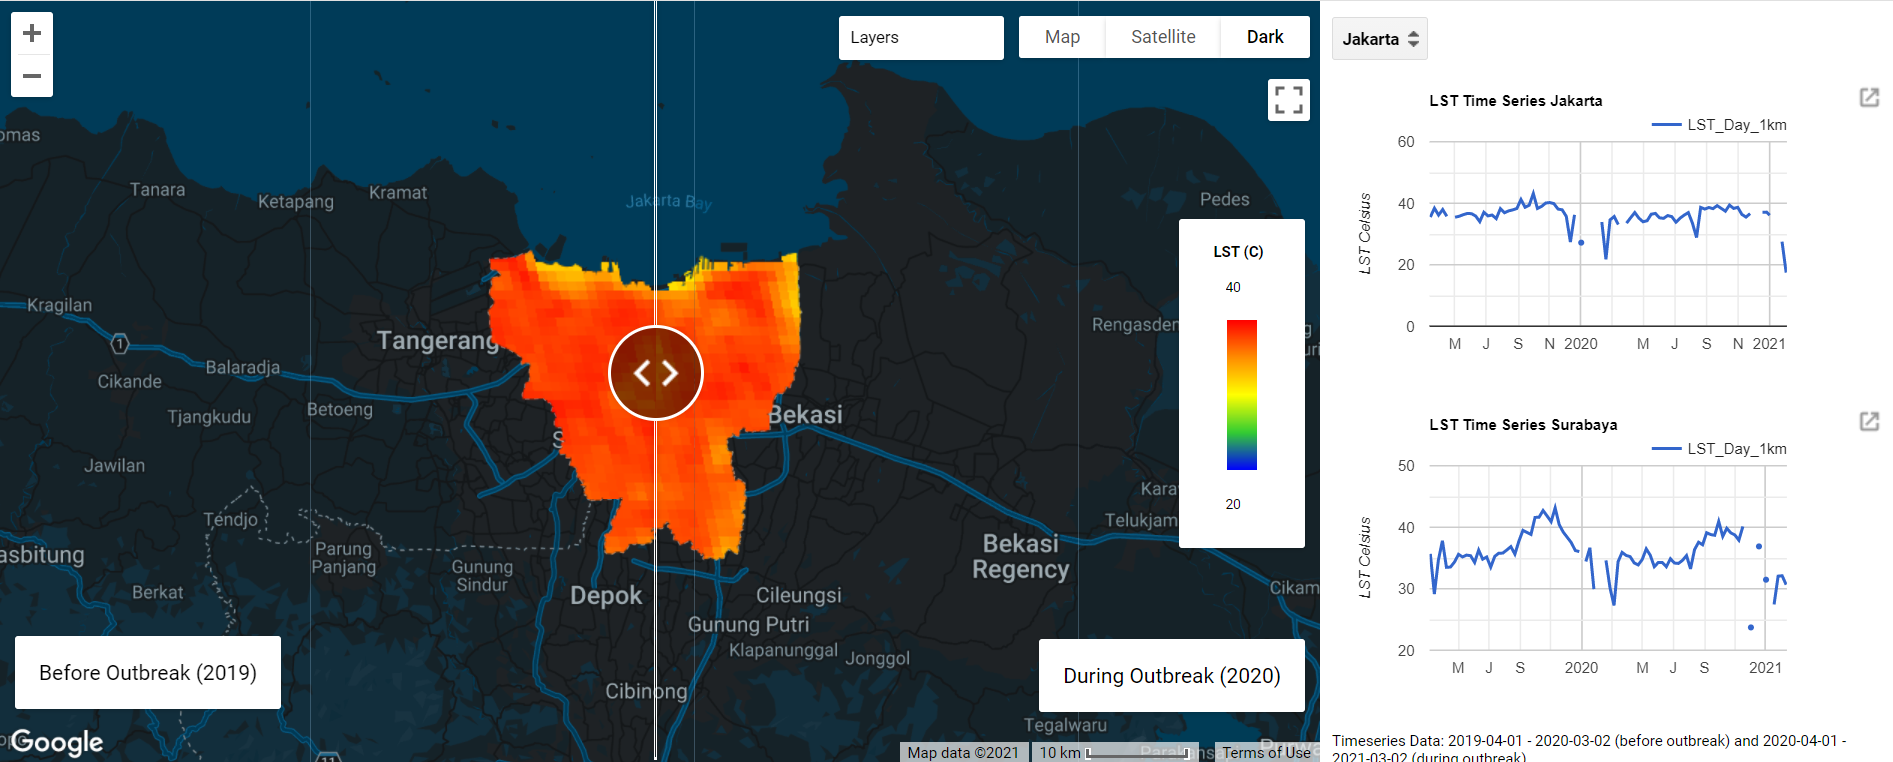
LST over Jakarta
-
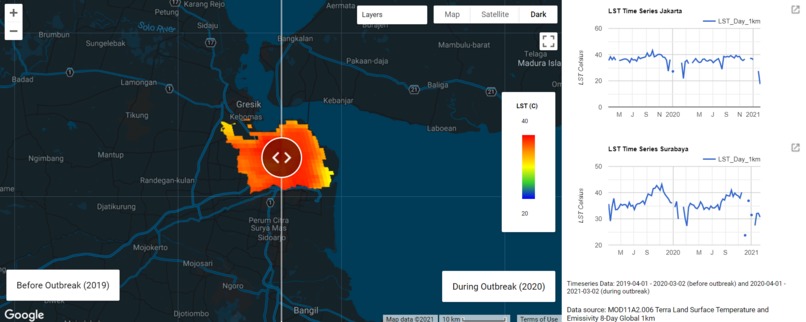
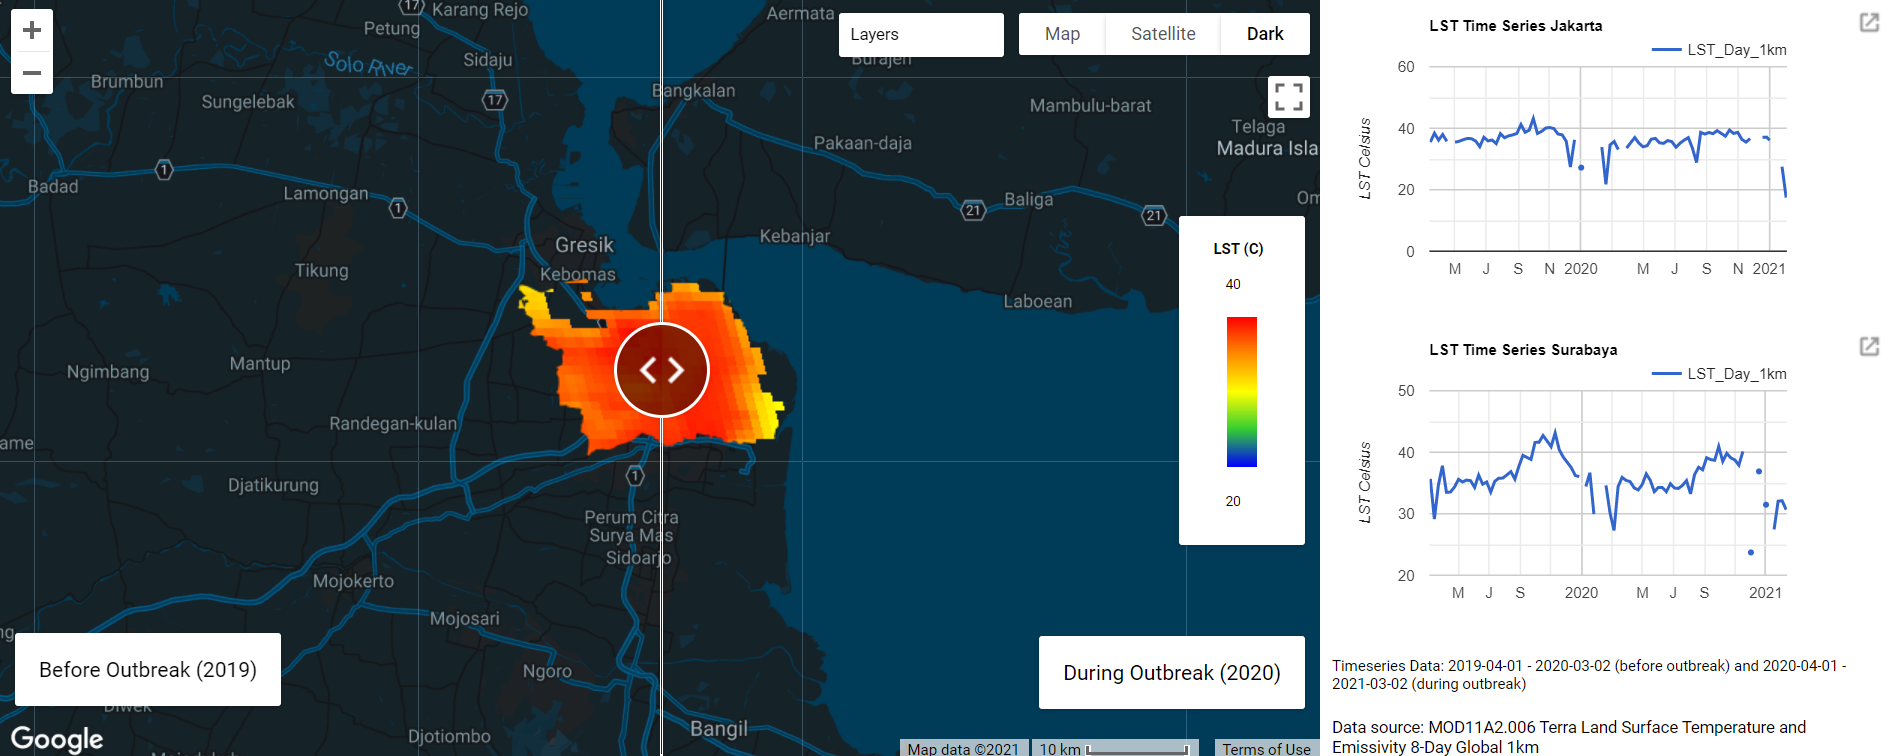
LST over Surabaya
Inspiration
Novel Corona Virus or COVID-19 has been pandemic all over the world since the end of 2019. Indonesia reported the first case of COVID-19 at the beginning of March 2020. Since then, the government has appealed to the public to reduce outdoor activities in order to reduce the potential spread of the virus. To obey the rule, many companies and institutions issued a policy called Work from Home (WFH). At the end of April, the provincial government of Jakarta issued large-scale social restrictions (locally called PSBB) and followed by other cities including Surabaya. Jakarta is central to the spread of the virus in Indonesia. While Surabaya is the second biggest city in Indonesia which has a high risk for the virus to be spread. This study aimed to analyze the Thermal Humidity Index (THI) over Jakarta and Surabaya, before and during the COVID-19 pandemic. Due to the social restriction policy, it is estimated that there is a difference in THI before and during the pandemic. The analysis has been done by using Google Earth Engine (GEE), a cloud-based platform for geo-spatial data analysis provided by Google. Archive data from MODIS Terra Land Surface Temperature and Emissivity 8-Day Global 1km from 1 to 14 May 2019 (before pandemic) and from 1 to 14 May 2020 (during a pandemic) were analyzed.
What it does
The result proved that the policy affected the decreasing of THI during pandemic. The platform shows us the dynamic change of THI over time until today.
How we built it
The analysis has been done by using Google Earth Engine (GEE), a cloud-based platform for geo-spatial data analysis provided by Google. Archive data from MODIS Terra Land Surface Temperature and Emissivity 8-Day Global 1km from 1 to 14 May 2019 (before pandemic) and from 1 to 14 May 2020 (during pandemic) were analyzed.
Challenges we ran into
It is using the optical data that affected by cloud cover. While Indonesia is mostly covered by cloud. So sometimes the dataset is masked-out in some area.
Accomplishments that we're proud of
The platform shows us the dynamic change of THI over time until today
What we learned
COVID-19 is cooling us down.
What's next for COVID-19 cooling us down. I proved it!
Do you want me to code it for your city? Just let me know!
Built With
- gee
- javascript


Log in or sign up for Devpost to join the conversation.