Inspiration
As an Australia resident, I wanted to see all the information regarding COVID-19 statistics/information for Australia. However, the information was spread everywhere and the government was not providing the statistics easy to understand.
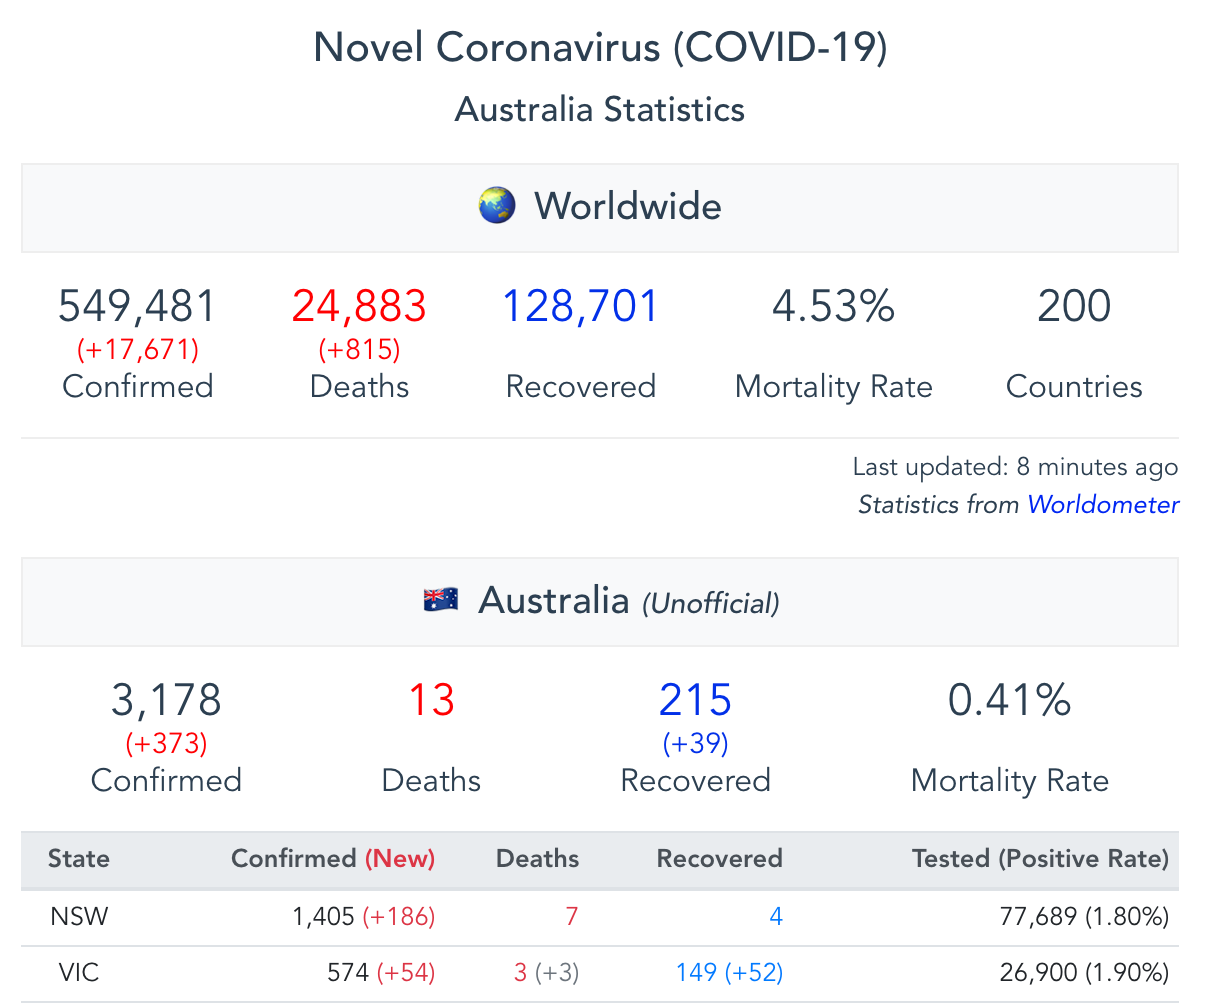
Therefore, I decided to develop a dashboard that collects information from various sources and display on a single page with different graphs & news.
What it does
- Collect official statistics from the Australian Government Department of Health
- Collect unofficial statistics from Wikipedia, Worldometer, The Guardian and Johns Hopkins University
- Display community news from Reddit
- Display news from Google
- Provide traveler alert from smarttraveller.gov.au
- Provide flights tracker to search flights that carried confirmed cases
- Refresh dashboard every minute; so you don't need to press F5
How I built it
Using Node.js to scrape/parse information from various sources Using Vue.js to display statistics and graphs
Challenges I ran into
Parsing statistics from various sources Hard to find real-time statistics
Accomplishments that I'm proud of
With this dashboard, I wouldn't need to go to various sources or search for what is happening in Australia. I can provide easy and good information to Australian.
What I learned
Providing fast, reliable information is important in this kind of unprecedented time.
What's next for COVID-19 Australia Dashboard
Continue to provide information that people can understand easy


Log in or sign up for Devpost to join the conversation.