-
-

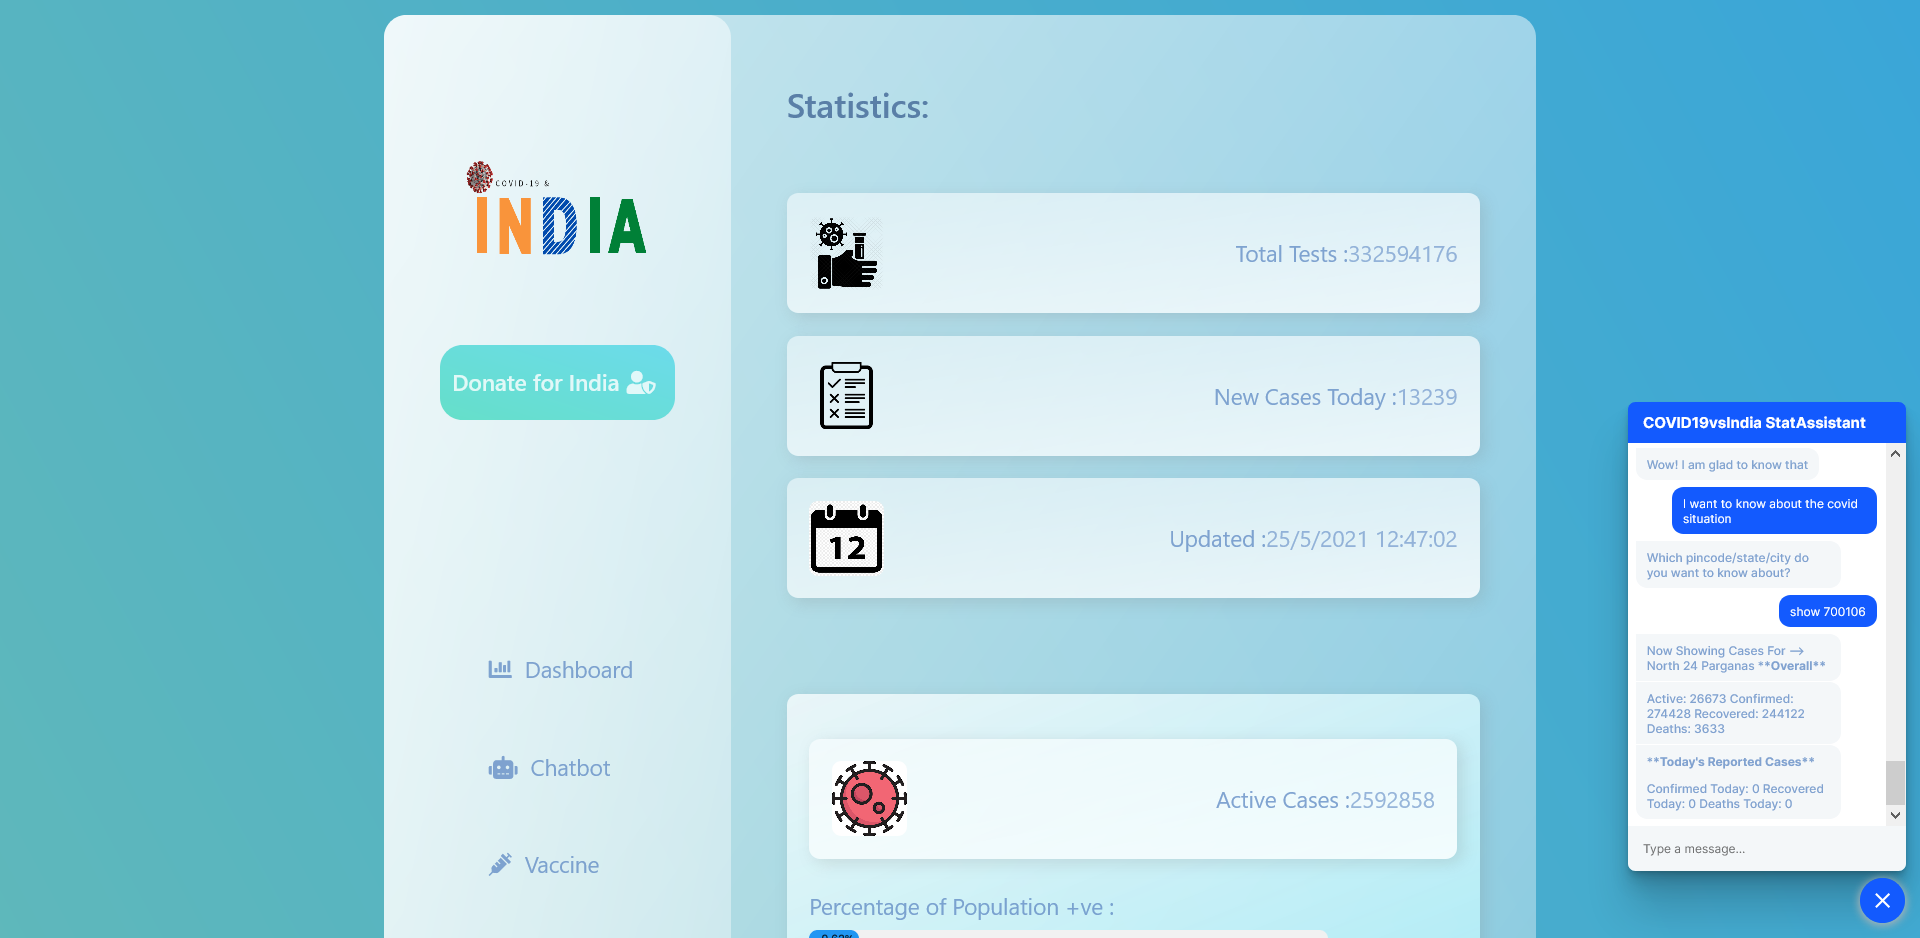
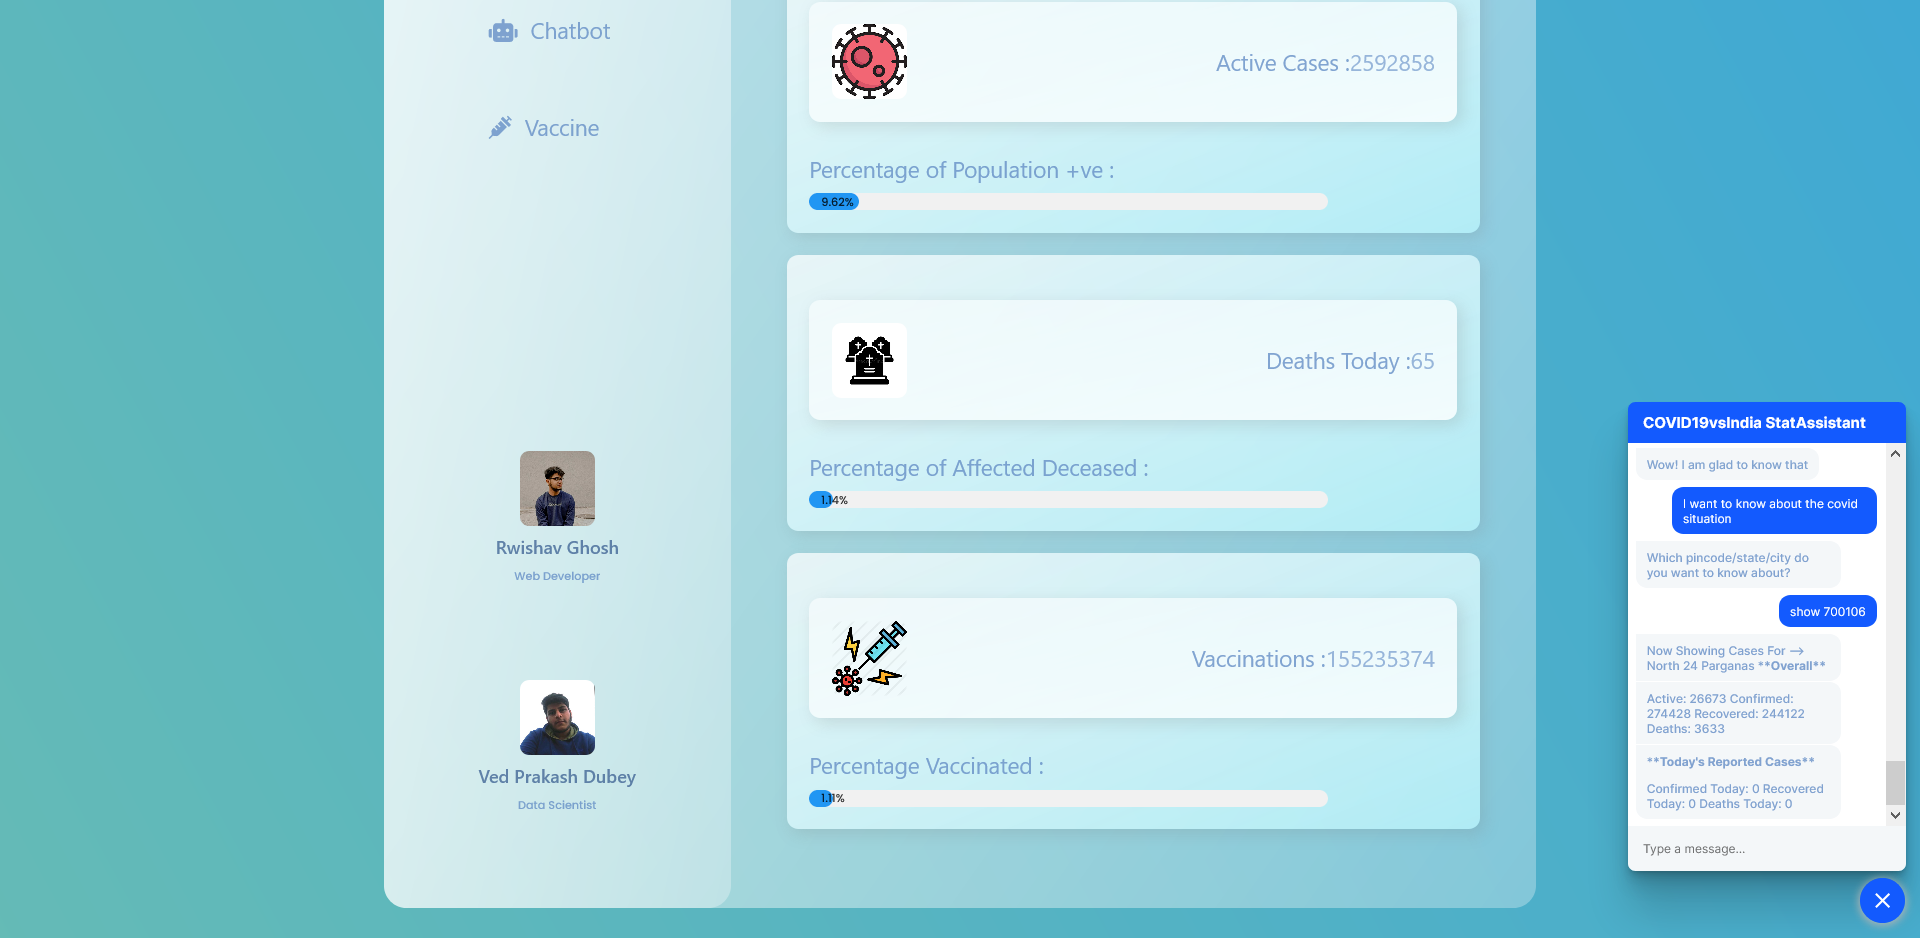
Home page with the COVID19 statistics of India which is being updated live along with the custom RASA Chatbot
-
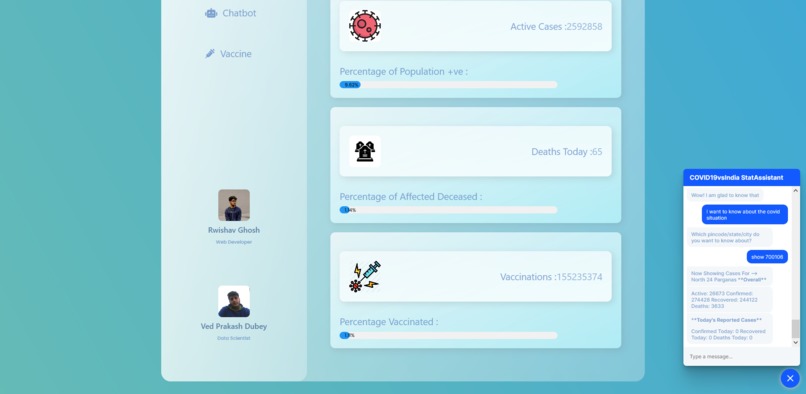
RASA Chatbot is visible which provides user with the live COVID19 statistics of their desired location
-

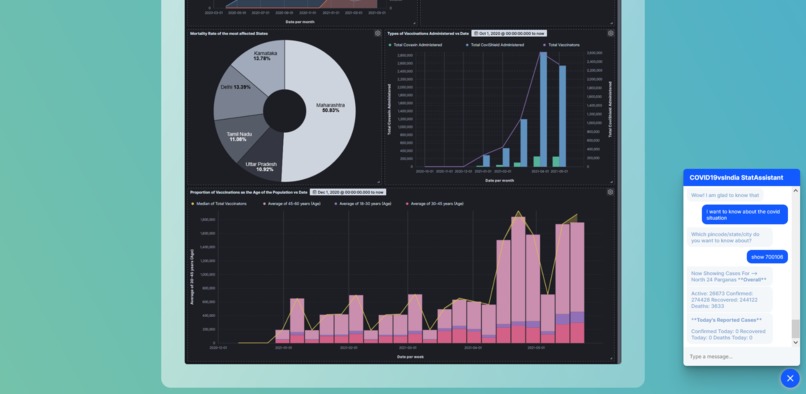
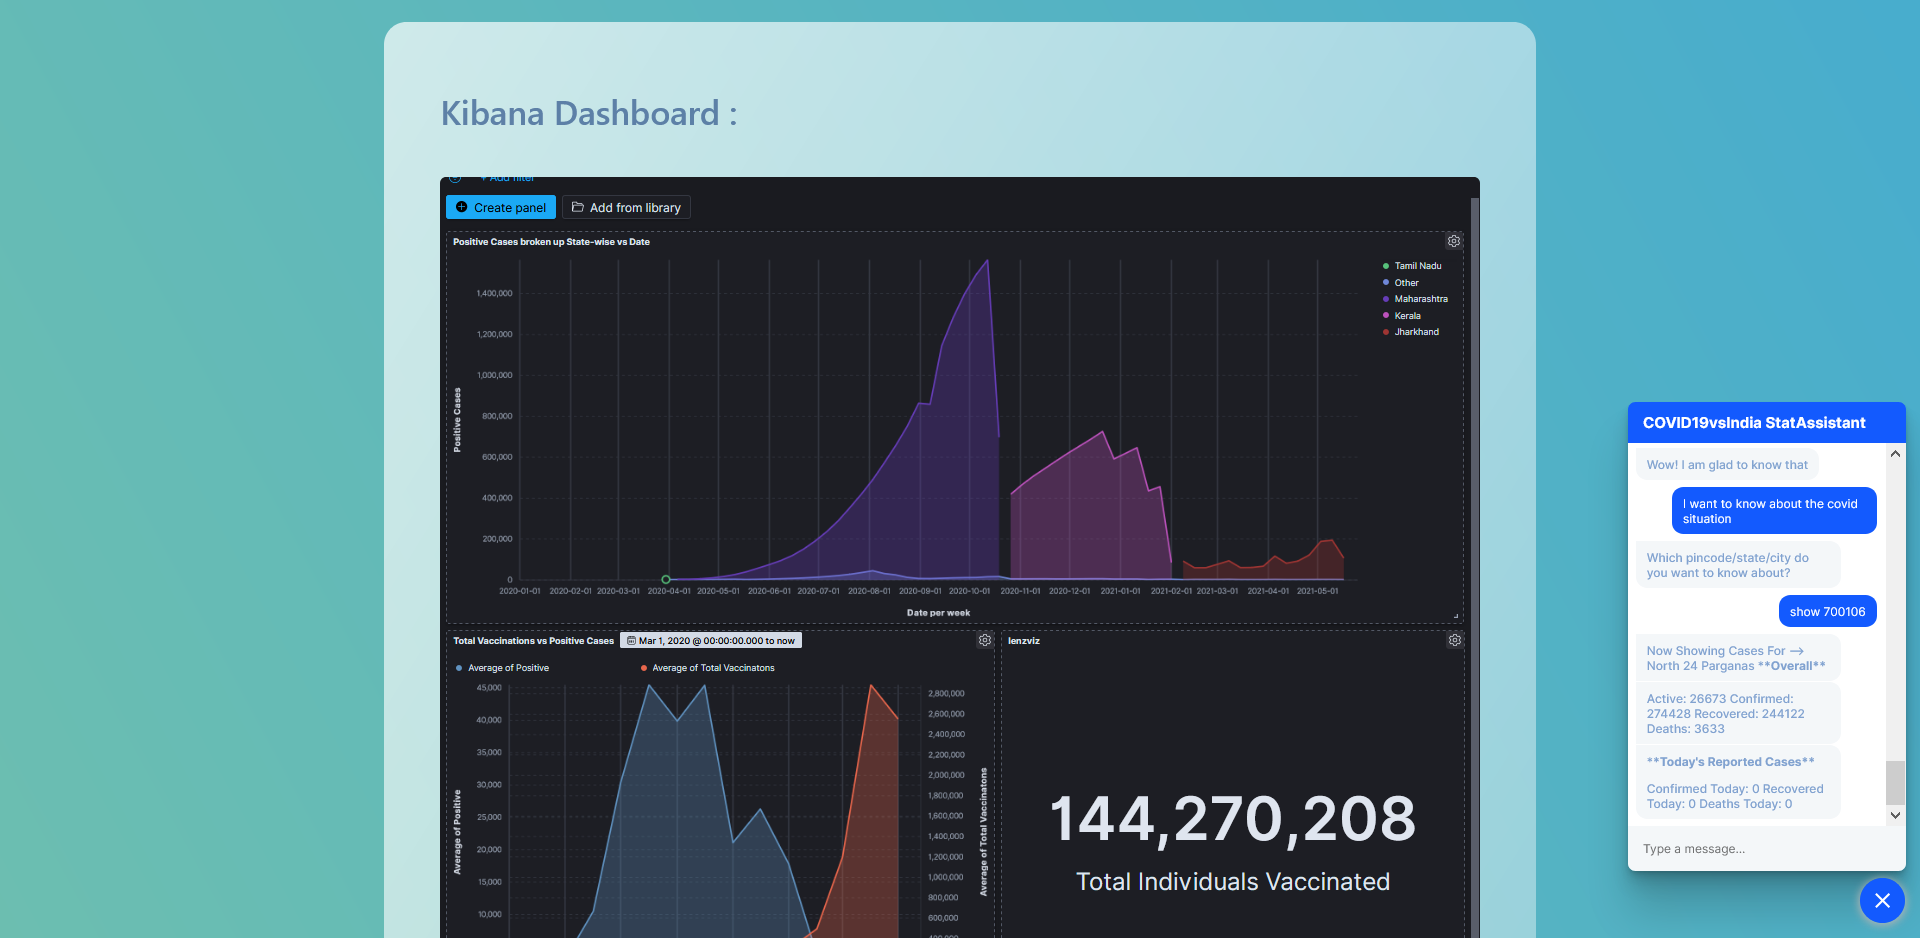
Kibana Dashboard that has been embedded into our web application
-
Continued

COVID19 & India: An Analytical and Interactive Approach
Inspiration
The recent surge in cases of covid-19 due to the second wave of the pandemic has created a crisis within the country. This calls for an analysis of how we've been handling the initial wave, how we are doing currently and what we can potentially do in the future. It is also important to make this information accessible to the people and that is what we aim to do.
What it does
All of the aforementioned has been made possible by working with the data we have, analyzing it thoroughly, and creating vivid and impactful visualizations that are not only appealing to look at but are also important in drawing inferences from the data. This is has been neatly surmised into a web application with an appealing UI that your average user can use to get a grasp of the situation. We have also integrated a chatbot into our web app that updates the users on location specific pandemic data through simple conversation.
How we built it
- Data preprocessing and sending the data to Elasticsearch using Bulk API.
- Analyzing the data using Kibana, and creating a dashboard of visualizations using it.
- Created an embeddable link of the dashboard.
- At this time the front-end of the website had been completed.
- Implemented live data update of COVID19 by writing scripts to read API's generated by scraping the web. Parsed the API into .JSON files and extracted data from them.
- Built a chatbot using RASA and Python, trained it on custom interaction, to make it handle general conversation. It is a chatbot that provides the user with the up-to-date pandemic stats which is location specific.
- All of the individual modules were integrated, and deployed to the localhost using Flask.
Challenges we ran into
- Getting the Bulk API to work with mapping in Elastic 7.12.1. This was fixed by using a generator function.
- Configuring Kibana user settings and authentication to make the embedded link open without prompting the login screen.
- Handling null values in the .JSON since the COVID19 API updates in real time.
- Implementing the RASA chatbot in our web app.
Accomplishments that we're proud of
- Implementing the Elastic stack in particular Elasticsearch and Kibana in order to perform data analysis and present impactful visualizations through the Kibana dashboard.
- Displaying Covid statistics that update in real time by reading from API's.
- Building a RASA chatbot by training it on custom interaction and also enabling it to update the user with location specific pandemic statistics.
What we learned
- How to efficiently use the Elastic stack in our project.
- Designing a progress bar for each statistic that updates in real-time along with the parsed data.
- Learning how to train and model a RASA chatbot to serve custom user requirements. Couple it with a UI and implement it with a proprietary web application.
What's next for COVID-19 and India : An Analytical and Interactive Approach
- Better and more appealing UI/UX implementation for the web application.
- Improving the RASA chatbot by training it with more interactions. Adding more APIs to it such as a news API which can provide users with related news headlines to covid. Adding a feature that can provide the user with requirements they need in the area, such as essentials, number of beds available in the nearby hospitals, vaccination sites, etc.
- Deploy the web application to the Internet.


Log in or sign up for Devpost to join the conversation.