-
-
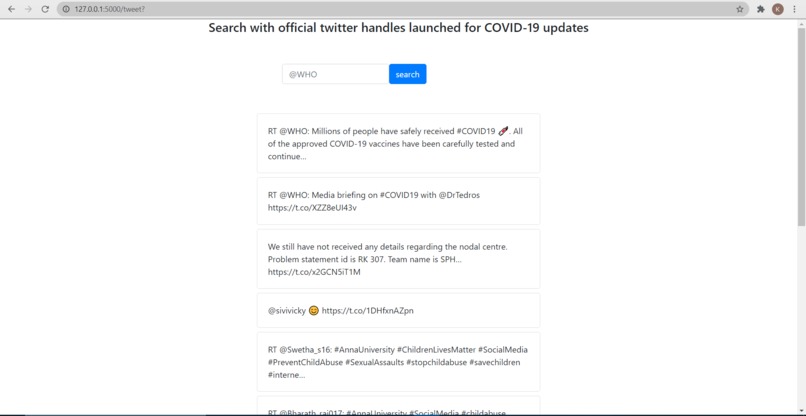
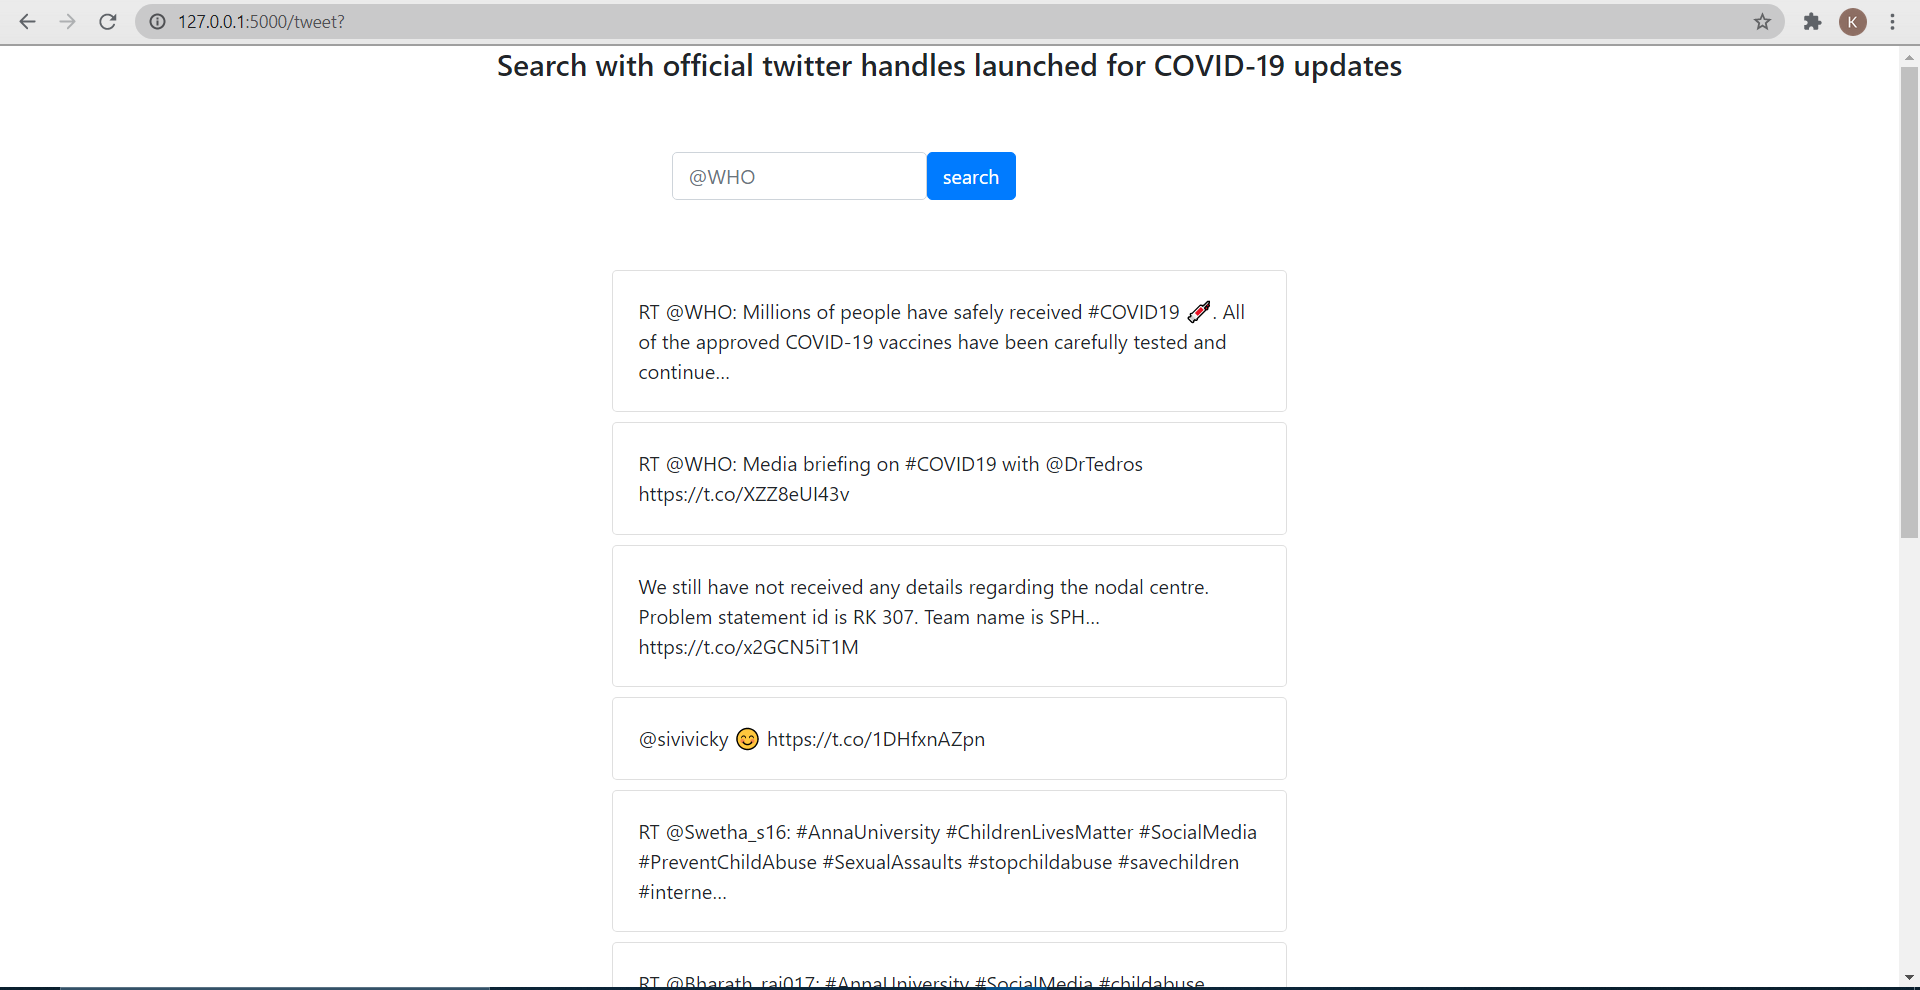
tweets page
-
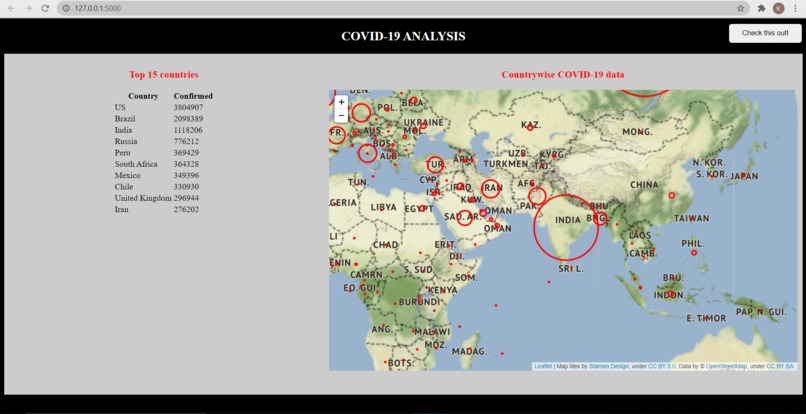
home page

Inspiration
On account of the current pandemic situation, I wanted to develop a website which could explore, analyse and visualise the available data to help people make more effective data-driven decisions.
What it does
As of now the website displays the top 10 highly affected countries based on the number of confirmed cases and there is a world map which shows confirmed cases as a pop up, circle marker and it's size depends on the no.of cases. Also there is a feature where the user can search tweets posted by a specific twitter handle so as to to know the updates.
How we built it
I used python, imported Flask besides using html, css and bootstrap to build the website. Imported pandas and Folium to process the data and visualise it in the world map. Imported tweepy to stream tweets based on the twitter handle. I already had an unused twitter developer account so using its credentials I was able to fetch the tweets.There are two web pages home.html and tweet.html where I have used html, css and bootstrap CDN.
Challenges we ran into
This was my first time using Flask and also I'm a beginner in python,bootstrap, so it was a bit challenging to learn, use and get the desired output. I have created websites before using basic html, css and php only.
Accomplishments that we're proud of
I was able to get the desired output successfully using flask to display the covid-19 analysis results and tweets are being posted on the website according to the user's input.
What we learned
I learnt Flask , folium and to fetch tweets and post it on the website.
What's next for COVID-19 Analysis
I am planning to widen the project by building a dashboard which could analyse all the ongoing global crises and to visualise more accurately since many people doesn't even know if such a crisis exists.
Log in or sign up for Devpost to join the conversation.