-
-

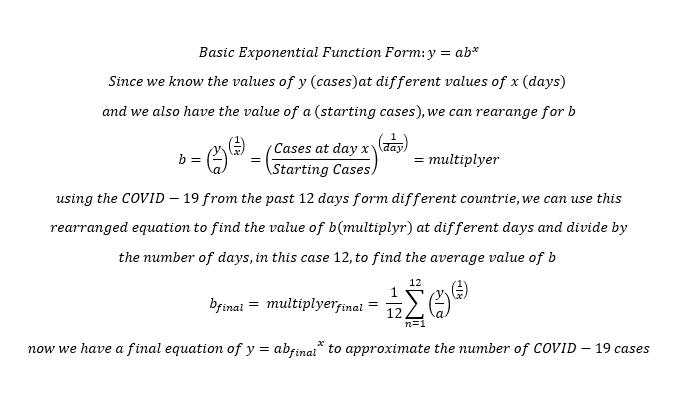
Explanation of Function Derivation
Inspiration
Our inspiration for this project is to find a way to relate to the largest issue every human faces on earth today, the COVID-19 pandemic.
What it does
Our project uses the past data from 5 different countries, Canada, USA, Australia, Britain and China, and specifically the increase in COVID-19 cases for the past 12 days. With this data, we would estimate through summations, the multiplier value of an approximation exponential function which would then be used to model the amount of COVID-19 cases in the 20 days to come. This function is also displayed in graphical form for users to visually understand how necessary it is to try and reduce even a couple cases, as with exponential pandemics, every uninfected person goes a long way.
How we built it
We first researched the increase of COVID-19 cases for the past 12 cases in multiple countries. With this data, we stored it in arrays inside of two separate dictionaries. Then, with rearranging the base exponential function (ab^x), we would estimate the value of b using while loops and summing the values of the multiplier at different days. Then, dividing by 11 to find the average, we would have our best approximation for the multiplier (b) of a approximation exponential function. Then, with our new found function, we would loop 20 times to create x_val and y_val arrays to display our data in graphical form using matplotlib library.
Challenges we ran into
Our main challenge was to represent our data in a graphical form. This is because we had to familiarize ourselves with the matplotlib library in python as neither of us had used it prior to WarwickHACK.
Accomplishments that we're proud of
This is both of our first hackathons and regardless of the result, we are proud of attempting this hackathon through these trying times and we hope we will attend many more to come.
What we learned
We learned the basics concepts of machine learning through Tim's lecture as well as basic python machine learning application. Also, as mentioned above, we learned to use the matplotlib library to graph our data.
What's next for COVID-19 Amazing Estimator
Attempt to further research trends in COVID-19 increases and see how the vaccination will impact these values. Although our current function is far from perfect, we want to explore new ways to find more accurate data.
Discord Usernames and Skill Levels
Steven -Beginner, Username: Steven#9317 | | Lukas-Beginner, Username: Lukas#0760
GitHub Repository
Link: https://github.com/LukasMM17/Covid19-Amazing-Estimator


Log in or sign up for Devpost to join the conversation.